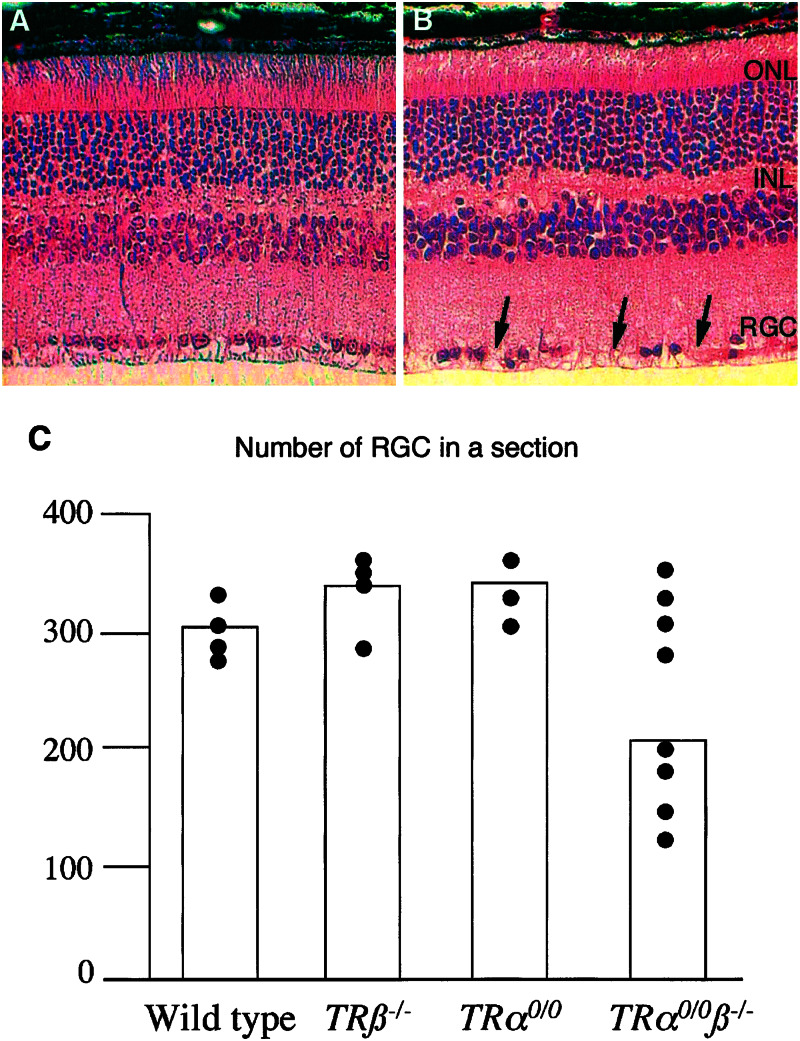
Figure 4.
Degeneration of the RGC layer in the retina of 6-month-old TRα0/0β−/− mice. (A) Wild-type retina section. (B) TRα0/0β−/− retina section stained with hematoxylin and eosin. ONL, outer neuronal layer; INL, inner neuronal layer; GCL, RGC layer. (C) Distribution of average nuclei number in the RGC layer (number of cells/retina section) of wild type, TRα00, TRβ−/−, and TRα0/0β−/−. For each retina, two median sections, including the optic nerve, were used. The average is plotted for each animal. All animals were from different litters. The wider distribution of the cell counts apparently for TRα0/0β−/− retina prevents the use of conventional statistical tests. We thus performed the statistical analysis as follows. We made the assumption that the theoretical distribution is identical for the three other genotypes and calculated a confidence interval (318 ± 25 RGC/section). This allowed us to define a threshold (293, P < 5%), under which the number of RGC is lower than normal. With this criterion, four of eight TRα0/0β−/− retinas showed clear signs of RGC degeneration.

