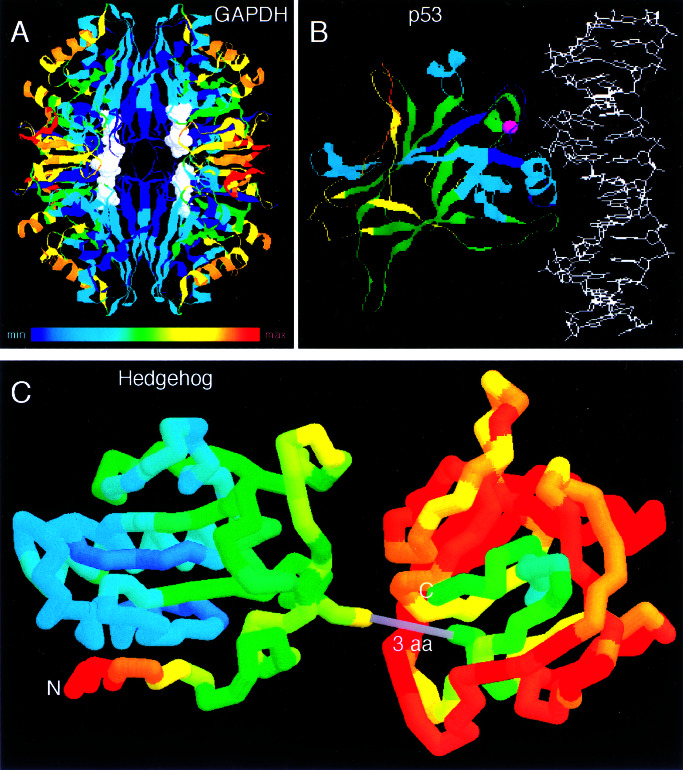
Figure 2.
Visualization of relative rates in structures using a color spectrum; blue represents the slowest rates, orange and red the highest. This figure was prepared using RASMAC Version 2.6 (ref. 18; http://www.umass.edu/microbio/rasmol/) and modified Protein Data Bank (PDB) files (ref. 19; ht) in which the temperature field was substituted with the relative rate scaled linearly to span the range of available colors. (A) GAPDH tetramer (PDB ID code 1GD1). (B) The p35 core bound to DNA (PDB ID code 1TUP). (C) Virtual fusion of the N terminus of mouse Sonic Hedgehog (PDB ID code 1VHH) with the C terminus of Drosophila Hedgehog (PDB ID code 1AT0). Only three amino acids (3 aa) in the alignment separate the structures of the two domains.

