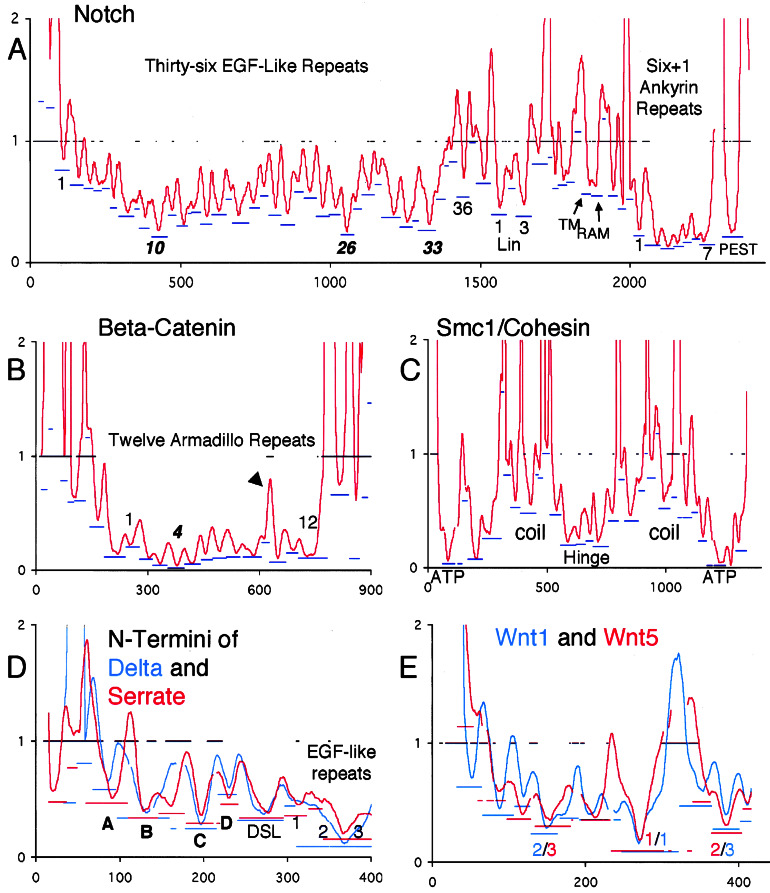
Figure 3.
RPs for five case studies. x axis, position in sequence alignment; y axis, smoothed relative rates for emphasis on detection of ECRs. Bars at y = 1 indicate regions of uncertain alignment. Blue and/or red bars underneath ECRs indicate the rate of the most slowly evolving window in the ECR (position on y axis) and the extent of the inferred ECR (extent along x axis). ECRs whose troughs are entirely contained with a region of uncertain alignment should be disregarded, but note that the resolution of the graphic is limited. (A) Notch; ECRs at the start and end of the repeat regions are labeled with the number of the repeat to which they correspond. Most-slowly evolving repeats are in italics. The gap just N-terminal to the PEST ECR corresponds to 180 highly divergent positions. (B) β-catenin/armadillo; arrowhead points to quickly evolving insertion in repeat 10. (C) SMC1/cohesin with the five known regions labeled. Note that each region contains several ECRs. (D) Overlay of the N-terminal RPs of Delta and Serrate prepared as described in Fig. 1. Gaps in the plots are due to alignment of the RPs to each other. Novel predicted domains are labeled in bold. (E) Overlay of Wnt1/wg and Wnt5a/b plots. The ranks of the three most slowly evolving ECRs are in the color corresponding to the paralog to which they belong. The sequences from human Wnt1 that correspond to the most slowly evolving windows in ECRs 1, 2, and 3 are, respectively, CKCHGMSGSCTVRTCWMRL, VNRGCRETAFIFAITSAGV, and CNSSSPALDGCELLCCGRG.

