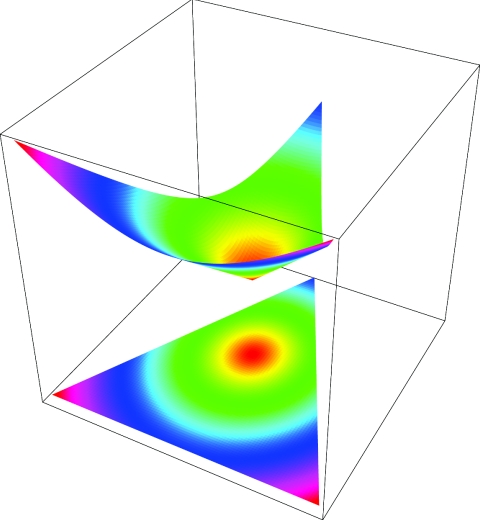
Figure 2.
Euclidian distances in the space of IBD distributions. The curved plane shows the relation between the informativity of a specific IBD distribution and the weight assigned to this distribution. Weights increase with increasing distance from (1/4,1/2,1/4), which is the center of the displayed circles. The triangle below the plane is an orthogonal projection of the contours of the plane above.

