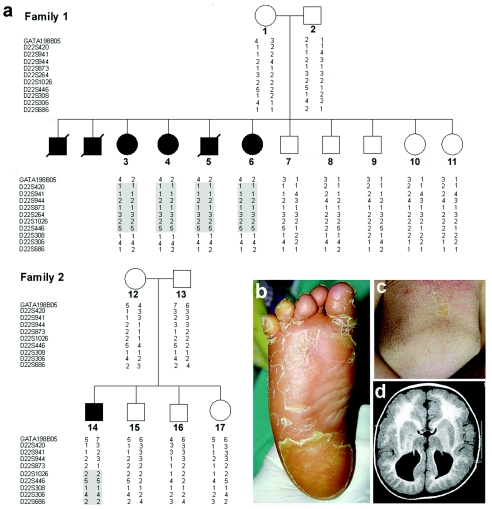
Figure 1.
Family trees, genotyping, and clinical spectrum of CEDNIK syndrome. a, Haplotype analysis in two families affected with CEDNIK syndrome, performed using polymorphic microsatellite markers on 22q11.2. Homozygous disease-associated haplotypes for each family are marked in gray. b, Severe thickening (keratoderma) of the plantar skin in patient 3. c, Lamellar ichthyosis over the abdominal surface in patient 14. d, Axial T1 (SE) weighted MR image demonstrating cortical dysplasia and pachygyria with polymicrogyria, as well as typical absence of corpus callosum, in patient 5.

