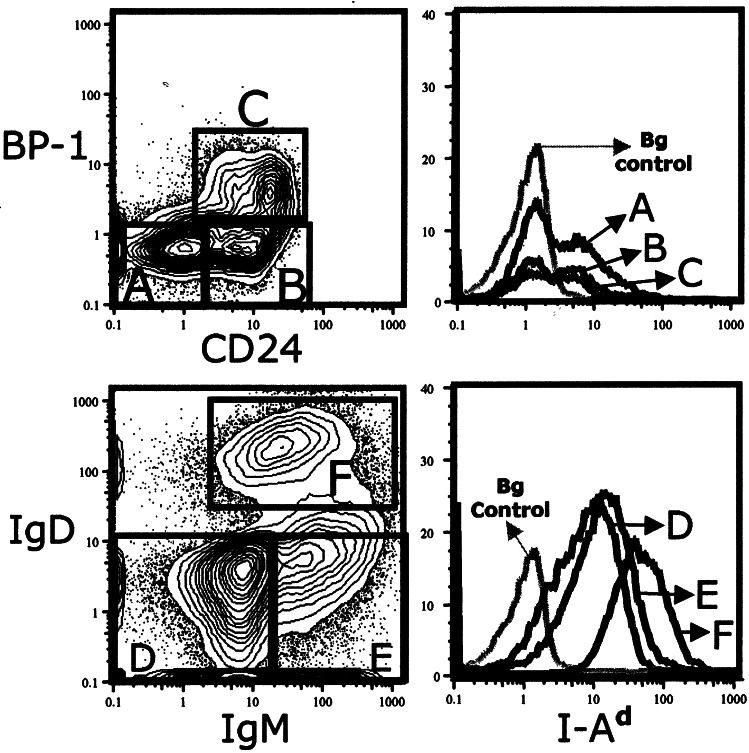
Figure 7.
FACS analyses for Ia expression in Hardy Frs. A-F. B220+ live cells from BALB/c BM were gated to include CD43+ cells (Frs. A-C; Upper Left) and CD43- (Frs. D-F; Lower Left). Histograms show Ia expression for cells in gates shown in Left. Background (Bg) control is shown in gray (for description, see legend for Fig. 6).

