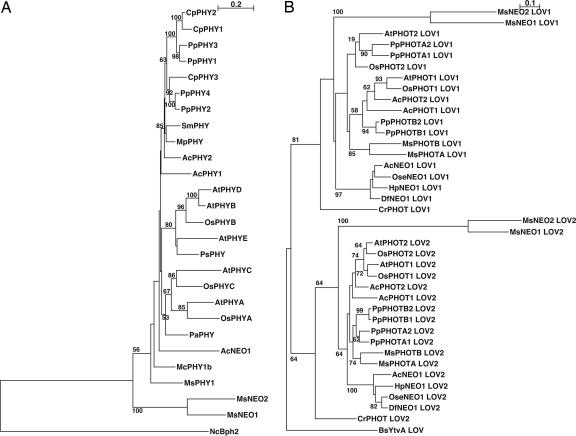
Fig. 2.
Phylogenetic trees of phytochrome sensor domains (A) and phototropin and neochrome LOV domains (B). Numbers indicate local bootstrap percent probabilities (only values >50% are indicated). (Scale bar indicates the evolutionary distance.) Phylogenetic trees were generated by clustalw. Complete species names and accession numbers of protein sequences are provided in Supporting Methods.

