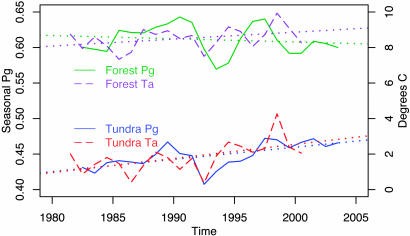
Fig. 2.
Seasonal amplitude of relative Pg for random samples from the tundra and interior forest cover types, and independent 10-km2 gridded temperature observations. Both are shown as averages for June, July, and August. The Pg data extend from 1982 to 2003 and the temperature data extend from 1982 through 2000. The dotted lines are fitted slopes and correspond to the values reported in the text.

