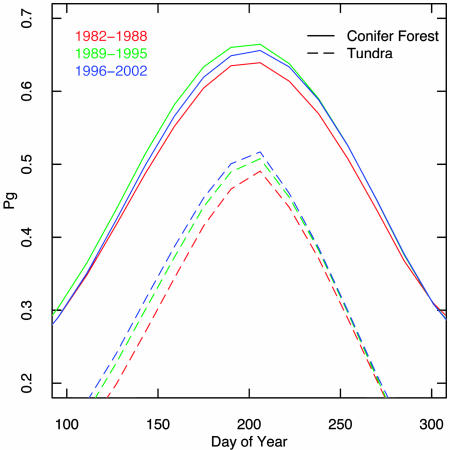
Fig. 3.
Changes in mean phenology of relative Pg over three 6-year periods, for the same data as shown in Fig. 2. Data from 1981 were not used because the record is incomplete, and data from 2003 are not shown for these three equally partitioned time intervals: 1982-1988, 1989-1995, and 1996-2002. See text for discussion of alternate intervals.

