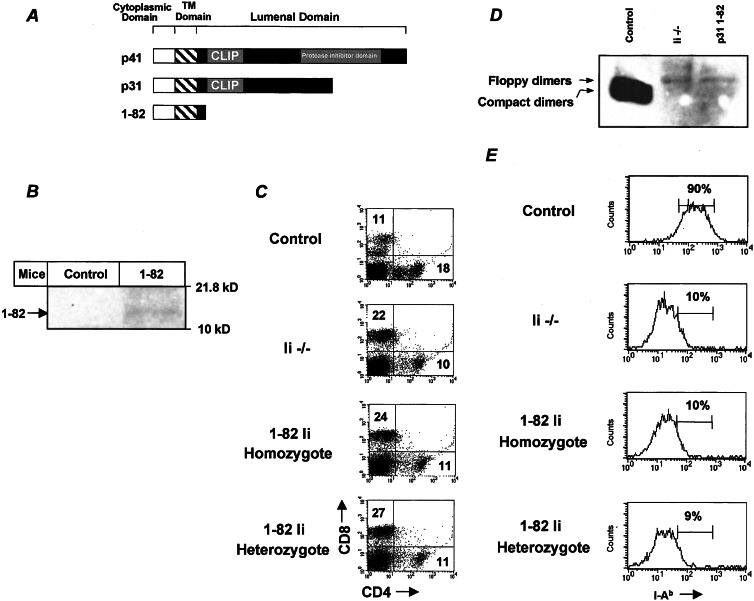
Figure 2.
Phenotype and lack of MHC class II expression of 1–82 transgenic mice. (A) A schematic illustration of Ii p31 and p41 isoforms and the 1–82 mutant used in this study. (B) Western blot analysis of 1–82 Ii expression in control and 1–82 mice. Splenocytes from control and 1–82 mice were lysed, and boiled lysates were separated on 15% (wt/vol) SDS/PAGE and analyzed with IN1 antibodies. (C) Splenocytes were double-stained with anti-CD8 and anti-CD4. Dot plots show the expression of these markers in each group of mice. The results presented are representative of five different experiments. (D) Analysis of steady-state levels of MHC class II expression. Splenocytes from control, Ii−/−, and 1–82 homozygotic mice were lysed, and unboiled lysates were separated on 12% (wt/vol) SDS/PAGE followed by Western blot analysis by using M5/114 antibodies. Floppy dimers and compact dimers are indicated by arrows. (E) Cells were double-stained with anti-B220 and anti-MHC class II. Histograms show the expression of MHC class II on B220-positive cells in each animal. The results presented are representative of seven different experiments.

