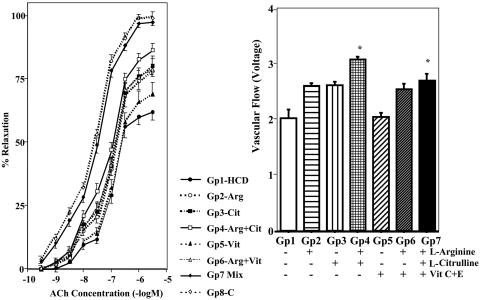
Fig. 1.
Vascular responses of thoracic aortas of rabbits. (Left) Cumulative concentration-response curves to acetylcholine (ACh) during contraction evoked by prostaglandin F2α (2.6 × 10⁻⁶ M) in thoracic aortas from eight groups of rabbits (n = 6 per group). (Right) Rate of blood flow near the right central ear artery in seven groups of rabbits (n = 6 per group). Refer to Materials and Methods for definitions of treatment groups. Data are illustrated as the mean ± SEM from six rabbits per group. *, Significant difference (P < 0.05) vs. Gp1-HCD.

