
Figure 6.
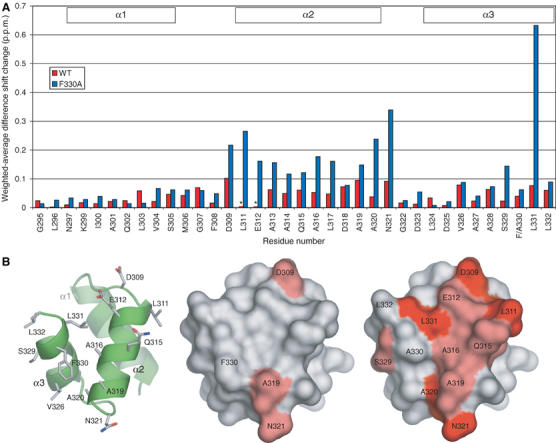
Comparison of Ub2 and monoUb-induced chemical shift perturbations of 15N-Mud1UBA WT and F330A. (A) Weighted average of the difference in chemical shifts induced in backbone amide HSQC peaks of 15N-Mud1UBA WT (red) and F330A (blue) obtained by subtracting 1H and 15N chemical shift changes induced by monoUb from those induced by Ub2. Resonances tagged with an asterisk (*) could not be identified at the end of the titration. (B) Molecular surface representation of the weighted-average shift differences on Mud1 UBA WT (center) and F330A (right). The intensity of the red color is proportional to the magnitude of the chemical shift difference. A visual guide to the structure is shown as a cartoon rendered in ribbon and stick mode (left).