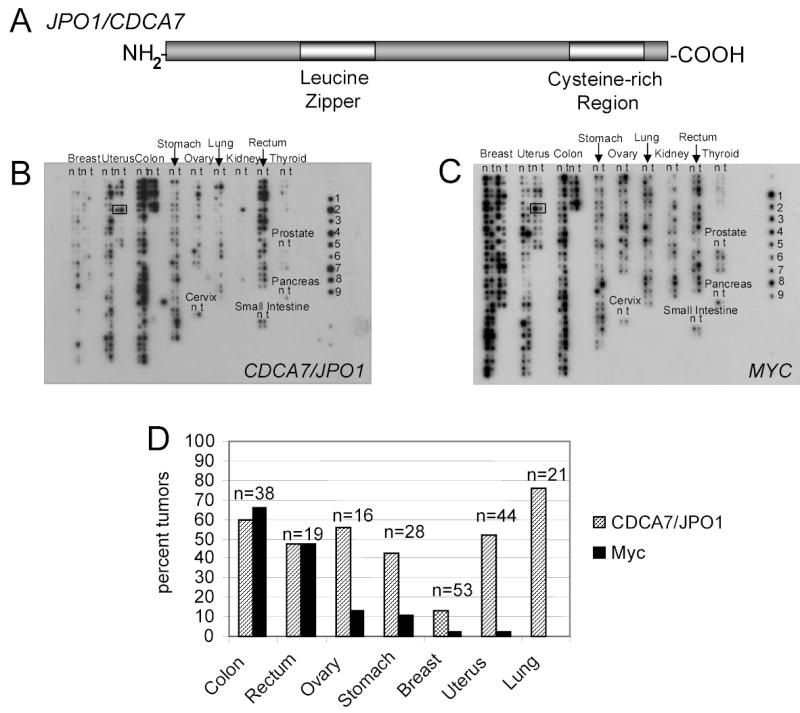
Figure 1.

A. Schematic representation of the JPO1/CDCA7 protein. Analysis of amino acid sequence predicts a leucine zipper in the amino terminal region and a cysteine rich region toward the carboxy terminus.
B. Multiple tumor array probed for JPO1/CDCA7. cDNAs are spotted in pairs, with normal samples spotted on the left in each column (N) and matched tumor sample (T) from the same patient spotted on the right in each column. An example from one patient pair is boxed in the uterus tumor section. Tissue type is indicated above each group of samples. Controls derived from cell lines are on the right and indicate: 1, HeLa; 2, Daudi (Burkitt’s lymphoma); 3, K562 (CML); 4, HL-60 (PML); 5, Melanoma; 6, Lung Carcinoma; 7, Lymphoblastic leukemia; 8, SW480 (colon); 9, Raji (Burkitt’s lymphoma).
C. Multiple tumor arrays probed for MYC. Blot is identical to that shown in B.
D. Quantitated JPO1/CDCA7 and MYC expression in solid tumors. Values represent the percentage of tumors that have a greater than 2-fold tumor to normal ratio for either JPO1/CDCA7 or MYC. All values were normalized to ubiquitin.
