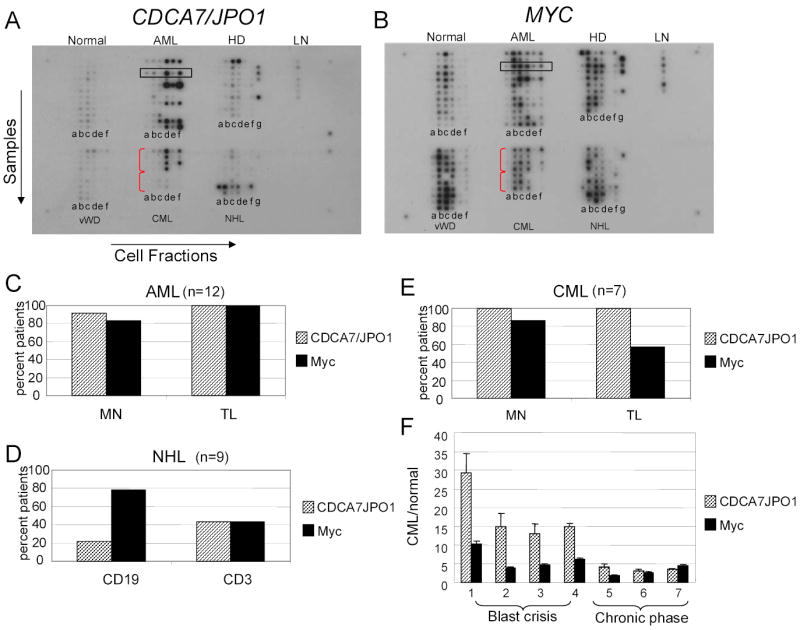
Figure 2.

A. Blood disease profiling array probed for JPO1/CDCA7. Each horizontal row represents cDNA from 6 cell fractions derived from a single patient, as indicated by the box in the AML section. Each vertical column represents samples for a given fraction as indicated by a letter below each column. The disease is indicated above each section. Abbreviations are: AML, acute myeloid leukemia; HD, Hodgkin’s disease; LN, normal lymph nodes; vWD, von Willebrand disease; CML, chronic myeloid leukemia; NHL, non-Hodgkin’s lymphoma. The blood fractions are as follows: a, CD14 (monocyte/macrophage); b, CD19 (B-cell); c, CD3 (T-cell); d, mononuclear cells; e, polymorphonuclear; f, total leukocyte; g, lymph node.
B. Blood disease profiling array probed for MYC. The array is identical to the one used in A.
C-E. Quantitation of CDCA7/JPO1 and MYC expression in hematologic malignancies. For each disease, the sorted fractions most likely to contain the neoplastic cells were analyzed. Note that the percent of patients with a greater than 2-fold disease to normal ratio based on array quantification is plotted for each fraction. The array included twelve patients with AML (A), seven with CML (B), and nine with NHL (C).
F. Expression of JPO1/CDCA7 and MYC in the individual CML patient samples. Plotted on the Y-axis is the normalized signal for JPO1/CDCA7 and MYC in each patient’s mononuclear sample, divided by the averaged signal detected in normal monocytes.
