Figure 6.

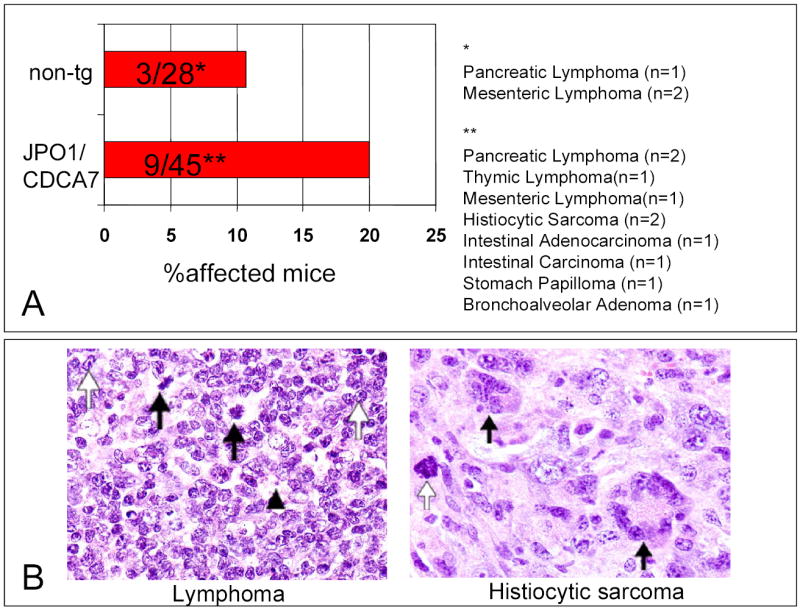
A. The rate of tumor formation in one year old JPO1/CDCA7 transgenic mice as compared to non-transgenic, age-matched littermates. Data is compiled from all 4 founders. Tumors observed were, for non-transgenic animals: pancreatic lymphoma (n=1), mesenteric lymphoma (n=2); for transgenic animals: pancreatic lymphoma (n=2), thymic lymphoma (n=1), mesenteric lymphoma(n=1), histiocytic sarcoma (n=2), intestinal adenocarcinoma (n=2), stomach papilloma (n=1), and bronchoalveolar adenoma (n=1). Note that one transgenic mouse had both a pancreatic and a mesenteric lymphoma, which were combined as one for determination of incidence.
B. Representative histology from necropsy of JPO1/CDCA7 transgenic mice. The left panel shows a lymphoma in pancreatic lymph node. Mitoses are indicated by black arrows, prominent nucleoli by white arrows, and a vesicular nucleus by the arrowhead. The panel on the right shows histiocytic sarcoma present in spleen. Black arrows indicate giant cells on a background of histiocytes, and the white arrow points out mitosis.
