
Figure 2.
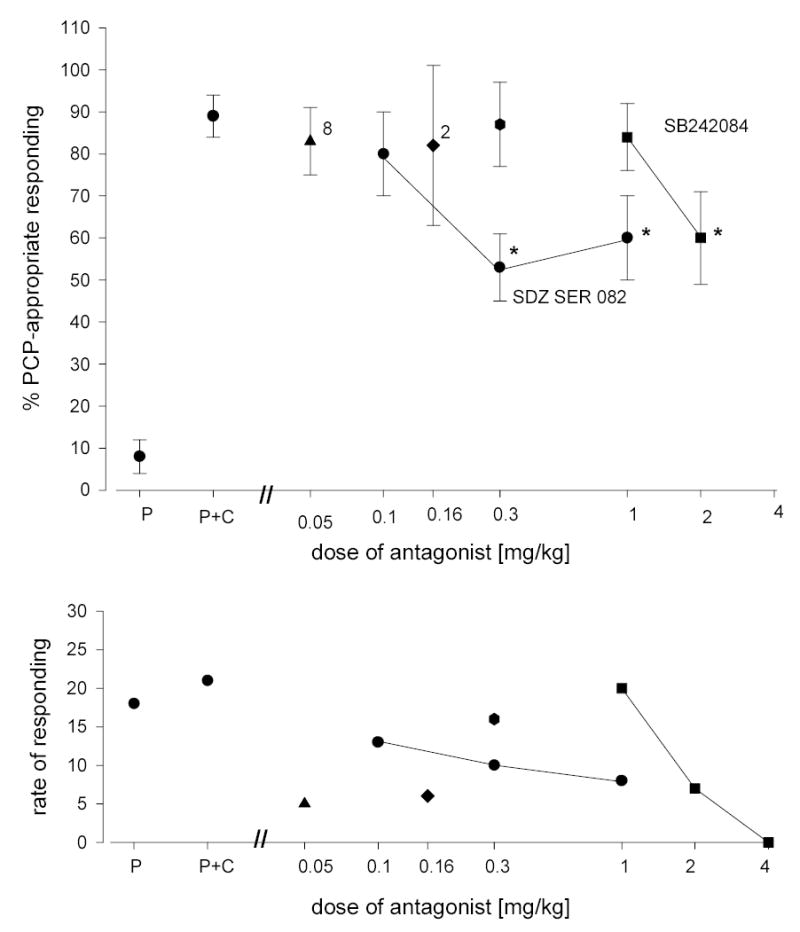
The effects of selected serotonergic antagonists on the potentiation of the stimulus effects of PCP [1.0 mg/kg; 30 minute pretreatment time] following the administration of citalopram [3.0 mg/kg; 90 minutes pretreatment time]. The point indicated by P on the abscissa is for PCP [1.0 mg/kg] alone. The point indicated by P+C on the abscissa is for the combination of PCP and citalopram. Other points shows the effects of P+C in combination with the 5-HT2A antagonist, M-100907 [triangle], the 5-HT2 antagonist, pirenperone [diamond], the 5-HT1A antagonist, WAY-100635 [hexagon], and the 5-HT2C antagonists, SDZ SER 082 [circles] and SB 242084 [squares], respectively. All points represent the mean of one determination in each of 10 rats. An asterisk indicates a statistically significant difference between P+C alone and in combination with an antagonist. A numeral adjacent to a point indicates the number of subjects completing the test if other than 10. Ordinate: upper panel: percent PCP-appropriate responding. Lower panel: rate expressed as responses per minute. Abscissa: dose plotted on a log scale.