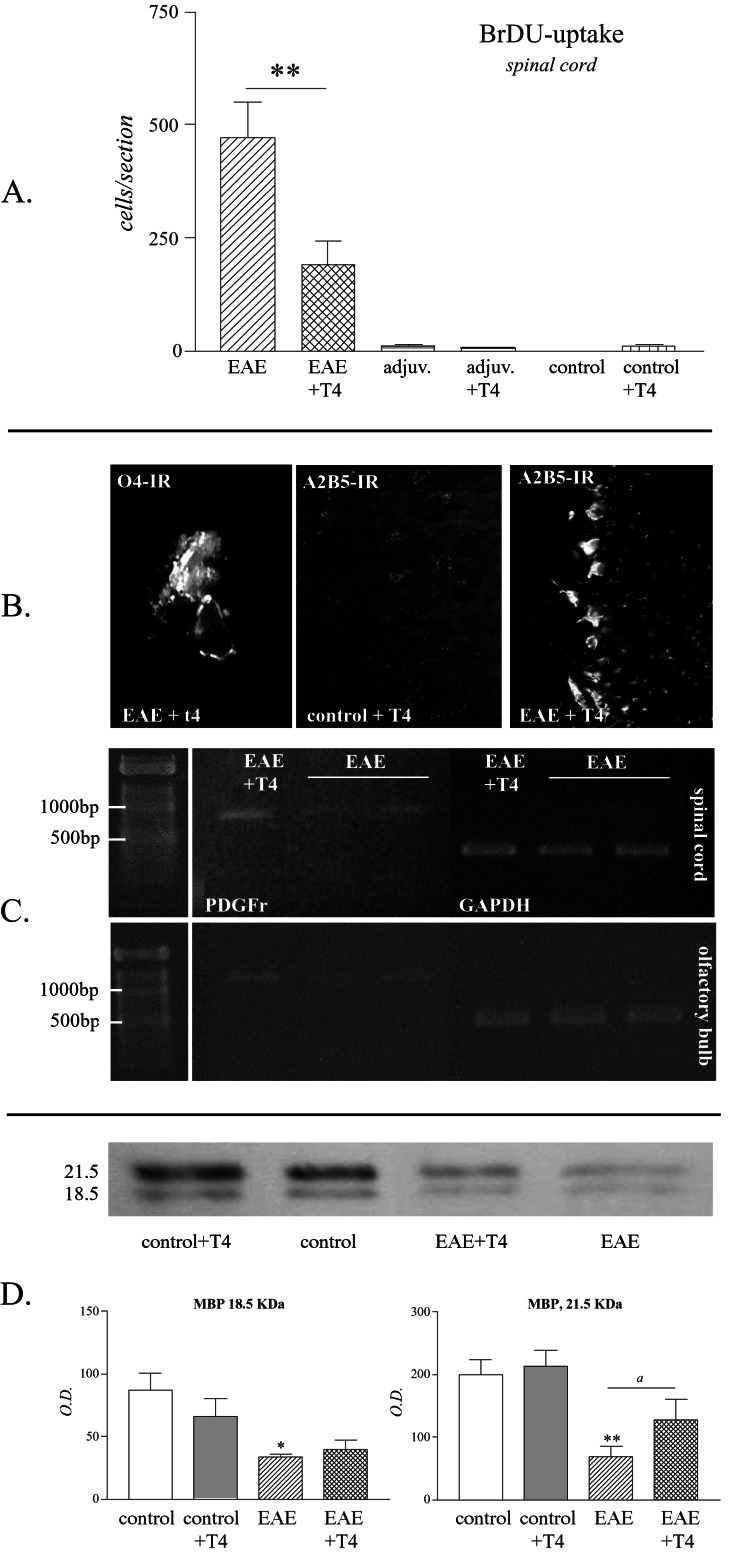
Figure 2.
T4 treatment decreases proliferation and favors oligodendroglial lineage and olygodendrocyte maturation in the spinal cord of EAE animals. (A) The histogram reports the count of BrdUrd-positive cells in the lumbar tract of the spinal cord in experimental groups. Data are means ± SE from six animals per group. Statistical analysis: Student's t test, **, P < 0.01. (B) Micrographs illustrate O4-positive cell in the spinal cord of EAE animals treated with T4 and the up-regulation of A2B5 in the same experimental condition in the olfactory bulb. (C) Reverse transcription–PCR analysis of PDGFRα mRNA in EAE and after T4 treatment in the spinal cord and olfactory bulb. (D) Western blot and quantitative analysis of 21.5- and 18.5-kDA MBP proteins. Data are means ± SE from five animals per group. Statistical analysis: Anova and Dunnett test, *, P < 0.05, **, P < 0.01; Student's t test for T4 effect, a, P < 0.05. (Magnifications: 04: ×500; A2B5: ×250.)

