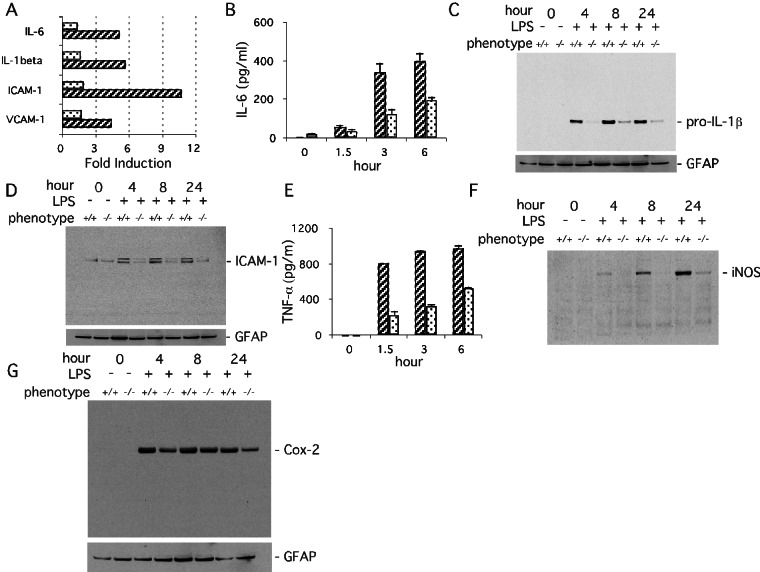
Figure 2.
PARP-1 regulates efficient gene expression in primary mixed glial cells activated with LPS. (A) Profile of LPS-induced gene expression from primary PARP-1+/+ (hatched columns) and PARP-1−/− (dotted columns) glial cells measuring mRNA formation in a microarray analysis. Transcription of IL-6, IL-1β, ICAM-1, and vesicular cell adhesion molecule-1 (VCAM-1) in PARP-1+/+ glial cells was induced markedly by treatment with LPS (1 μg/ml) for 2 h and diminished markedly in PARP-1−/− cells. The induction levels of genes were normalized by glyceraldehyde-3-phosphate dehydrogenase and β-actin expression. Forty-three genes of mouse inflammatory response cytokines and the mouse NF-κB pathway genes were analyzed. Only differences greater than 2-fold between PARP-1+/+ and PARP-1−/− were considered significant. (B) Release of IL-6 in primary glial culture. LPS-stimulated (1 μg/ml) release of IL-6 was attenuated markedly in PARP-1−/− (dotted columns) compared with PARP-1+/+ (hatched columns) cells. IL-6 release was quantified by ELISA. Values represent the means ± SE from triplicate samples. The results are representative of three independent experiments. (C) Expression of pro-IL-1β in primary glial cells. LPS-stimulated (1 μg/ml) expression of pro-IL-1β was virtually abolished in PARP-1−/− cells. Pro-IL-1β was visualized by immunoblot with 50 μg of total protein. GFAP, glial fibrillary acidic protein. (D) Expression of ICAM-1 in primary glial cells. LPS-stimulated (1 μg/ml) expression of ICAM-1 was reduced substantially in PARP-1−/− cells. ICAM-1 protein was visualized by immunoblot with 50 μg of total protein. (E) Release of TNF-α in primary glial culture. LPS-stimulated (1 μg/ml) release of TNF-α was attenuated significantly in PARP-1−/− (dotted columns) compared with PARP-1+/+ (hatched columns) cells. TNF-α release was quantified by ELISA. Values are the means ± SE from triplicate samples. (F) Expression of iNOS in primary mixed glial cells. LPS-stimulated (1 μg/ml) expression of iNOS was attenuated notably in PARP-1−/− cells. iNOS was visualized by immunoblot with 70 μg of total protein. (G) Expression of Cox-2 in primary glial cells. LPS-stimulated (1 μg/ml) expression of Cox-2 was attenuated only slightly in PARP-1−/− compared with PARP-1+/+ peritoneal macrophages at 4 and 24 h. Expression of Cox-2 was visualized by immunoblot with 70 μg of total protein.

