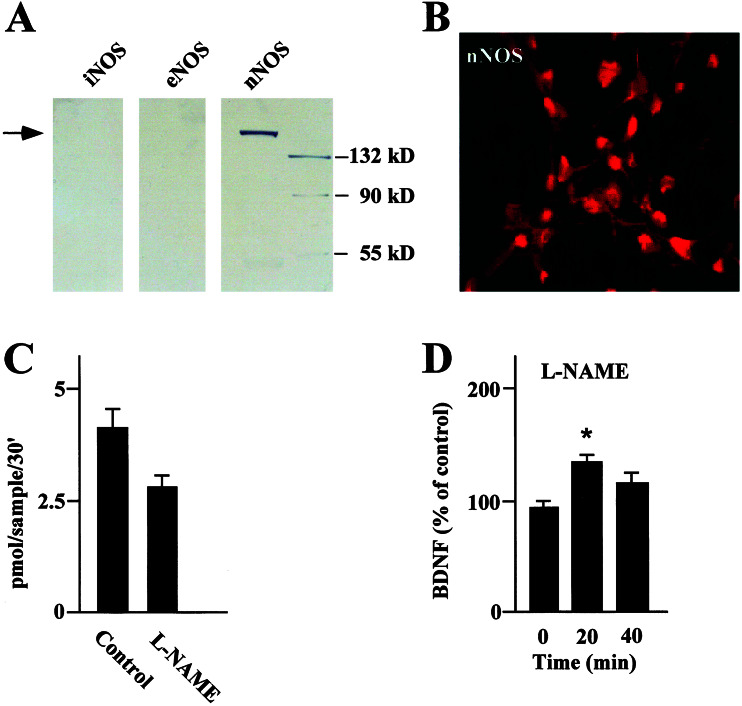
Figure 2.
(A) Western blots of NOS isoforms (neuronal NOS, endothelial NOS, and inducible NOS) in extracts of hippocampal neurons performed by using selective antibodies. Only nNOS was significantly expressed at the predicted molecular weight (arrow). (B) Expression of nNOS in hippocampal primary neurons evaluated by immunocytochemistry. Shown is a representative image from a confocal scan along the x-y plane. nNOS displays a uniform distribution in the cell body and in the dendritic processes of most of the neurons. (C) NO synthesis evaluated by monitoring L-[3H]citrulline formation from L-[2,3-3H]arginine. The level of NO production was evaluated in the absence (Control) or presence of 1 mM L-NAME, a NOS inhibitor. Data were expressed as picomoles of NO per sample per 30 min. (D) BDNF secretion evaluated in the absence (0 min) or presence (10 and 20 min) of L-NAME. Values are given as mean ± SE (n = 10). * indicates statistical significance of the difference from the control at P < 0.05.

