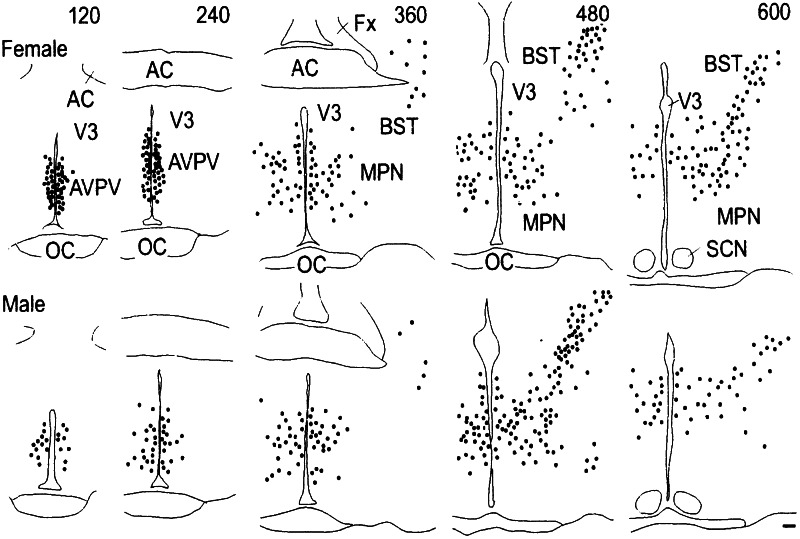
Figure 3.
Schematic representation of the distribution of ERβ mRNA-positive cells in the forebrain of female and male rats through rostrocaudal axis. Each dot represents five labeled cells. Numbers at the top of each panel represent distance from the organum vasculosum of the lamina terminalis in μm. (Scale = 100 μm.) AC, anterior commissure; AVPV, anteroventral periventricular nucleus; BST, bed nucleus of the stria terminals; Fx, fornix; MPN, medial preoptic nucleus; OC, optic chiasm; SCN, suprachiasmatic nucleus; V3, third ventricle.

