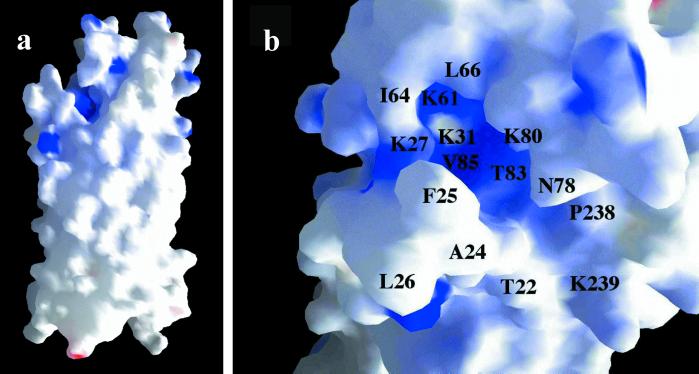
Figure 3.
Surface representations of OpcA, colored by electrostatic potential with blue as positive charge and red as negative charge. (a) Structure of a whole OpcA monomer. The proposed proteoglycan-binding site with its concentration of positive charge is visible at the top left of the molecule. (b) Detail of the proposed binding site, viewed from above, with specific residues marked. The diagram was generated by using GRASP (43).

