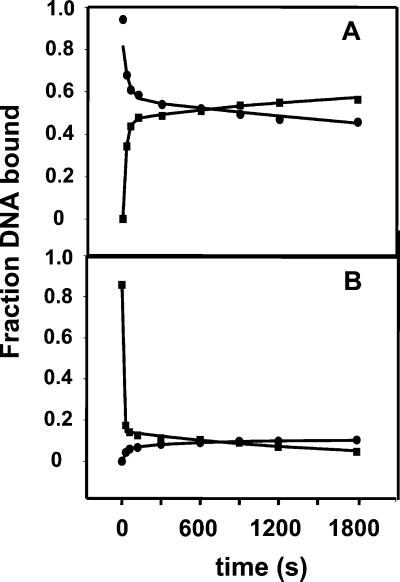
Figure 5.
Comparison of the kinetics for formation and dissociation of competitor-resistant complexes between RNAP and wt Fork. Association data (▪) were obtained as described in the text and the legend for Fig. 3 except the concentration of forked DNA was 10 nM. Dissociation kinetics (●) were obtained by challenging a mixture of 65 nM RNAP and 10 nM forked DNA that had been incubated for 30 min with 100 μg/ml heparin. The curves represent double-exponential fits of the data to Eq. 10. (A) wt RNAP. The observed association rate constants are shown in the legend to Fig. 3; for the slow phase of the dissociation of the wt Fork–wt RNAP complex, kd2 = (1.3 ± 0.2) × 10−4 s−1. (B) YYW RNAP. The slow phase of the association reaction has a ka2 = (1.1 ± 0.3) × 10−3 s−1; the slow phase of the dissociation reaction, a kd2 = (6 ± 1) × 10−4 s−1.

