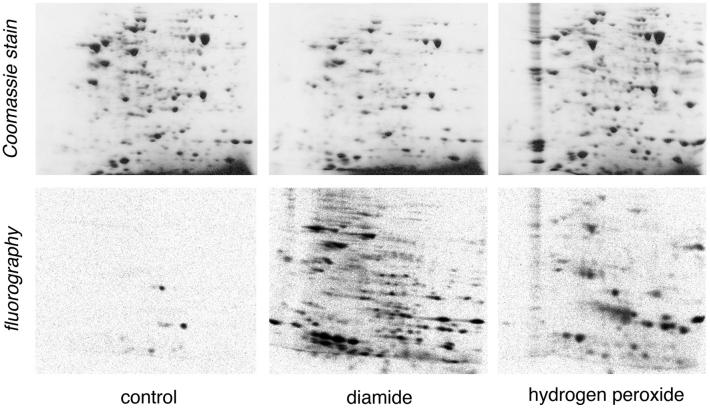
Figure 1.
Protein stain and glutathionylation pattern after two-dimensional electrophoresis of extracts from T cell blasts under basal conditions (control) or oxidatively stressed with 1 mM diamide or 1 mM H2O2. 35S labeling of the intracellular GSH pool and electrophoresis were performed as described in Materials and Methods. Proteins were separated based on pl (4-10 nonlinear gradient, left to right) and molecular weight (12% SDS/PAGE, top to bottom). Coomassie blue-stained maps are displayed (Upper) in comparison with fluorography (Lower). The experiment shown is representative of three and corresponds to experiment 3 as reported in Table 1.

