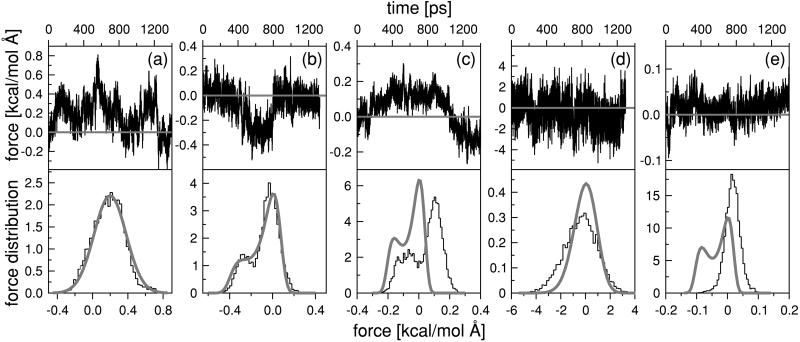
Figure 5.
Force time series (Upper) and the corresponding force distribution histograms P(F) (Lower) obtained for 1.4-ns MD simulations of Ras/GTP (a) and Ras/GDP (b-e). The stiffness constant k of the harmonic spring attached to the COM of the side chains of residues Tyr-32 and Gly-60 varied over k = 0.2 (a and b), k = 0.1 (c), k = 4 (d), and k = 0.05 (e) (in kcal/mol⋅Å2). The thick curves represent the theoretical predictions for P(F) by using the PMF method (see text).

