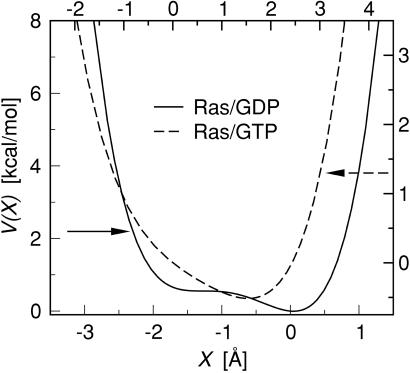
Figure 7.
Potential of mean force V(X) for Ras/GDP (solid curve) and Ras/GTP (dashed curve), obtained by fitting Peq(F) to the force distribution histogram P(F) corresponding to a spring with k = 0.2 (see text). As indicated by the arrows, the units on the left and bottom axes of the plot refer to Ras/GDP, and the units on the right and top axes refer to Ras/GTP. Minima of V(X) correspond to force-generating substates.

