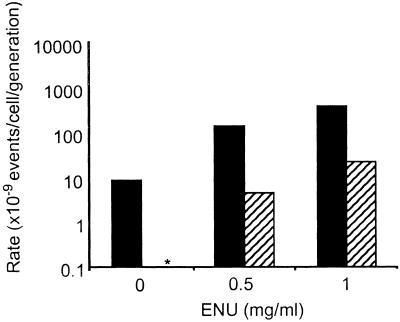
Figure 2.
ES cell mutation rate at Aprt and Hprt both increase after exposure to ENU. ES cells heterozygous at the Aprt locus were either treated with the indicated concentration of ENU (μg/ml) for a period of 5 h to measure ENU-induced mutant frequency or remained untreated to measure spontaneous mutant frequency. Mutation rate was calculated as previously described (13) and corrected for colony-forming efficiency. SEM is indicated. Solid bars indicate Aprt mutation rate, and hatched bars represent Hprt mutation rate. The asterisk indicates that no spontaneously arising Hprt mutants were detected (mutation rate <10−9).

