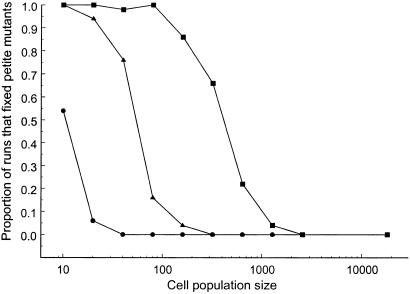
Figure 1.
Mitochondrial defects are fixed more frequently in model runs with smaller cell populations. Proportion of simulation runs that resulted in the accumulation of mitochondrial defects are shown as a function of the cell population size, N. The different symbols represent different within-cell replication advantages for the mitochondrial defects: (●) σ = 0.10, (▴) σ = 0.15, (■) σ = 0.20. Fifty replicates were run for each parameter value. The other model parameters were γ = 1.0, t = 5, and M = 15 (see text for details).

