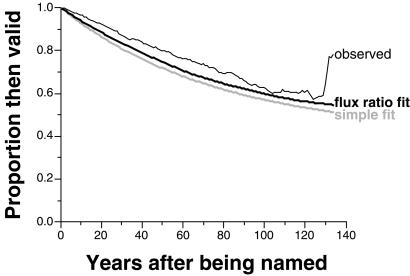
Figure 2.
Historical validity decay curves for named species. Curves show the proportion of all species that were thought to be valid a certain number of years after they were named. Thin black line = observed decay trajectory; thick black line = estimated trajectory based on flux ratio model; thick gray line = estimated trajectory based on simple decay model.

