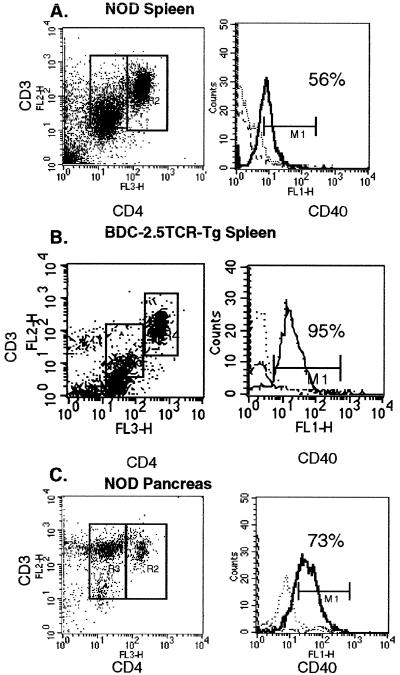
Figure 3.
CD40 Expression on NOD Splenic and Pancreatic T Cells. Cell suspensions were prepared from diabetic NOD spleen and pancreas and from diabetic BDC-2.5TCR-Tg spleens and then were passed over nylon wool to isolate T cells. Cells were treated with 2.4.G2 at 2 μg/ml to block nonspecific binding and stained as described in Materials and Methods (1 × 10⁶ cells were combined with directly conjugated Cychrome anti-CD4 (L3T4), PE anti-CD3, and FITC anti-CD40) and gated on forward vs. side scatter to remove nonspecific antibody binding cells from analysis. Dot plots are CD4 vs. CD3 stained T cells, and 15,000 events were acquired. Histograms represent CD40 expression in the gated regions, wherein the dotted line is isotype control, the dashed line is from the CD4hi cells, and the solid line is from the CD4lo cells.

