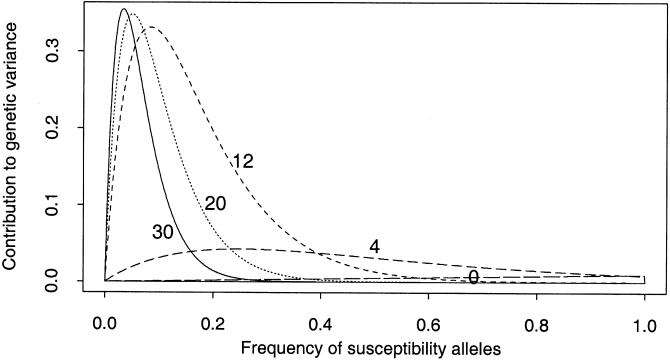
Figure 2.
Contribution to the additive genetic variance as a function of allele frequency. The plot shows how much of the (expected) additive genetic variance is due to alleles of a given frequency. The vertical axis is in units of 2δ2, where δ is the marginal increase in penetrance caused by each susceptibility allele. The integral of each curve equals the expected additive genetic variance. The lines are labeled with the assumed values of σ: 0.0, 4.0, 12.0, 20.0, and 30.0; mutation rates are βS=1.0, βN=0.01 for all.

