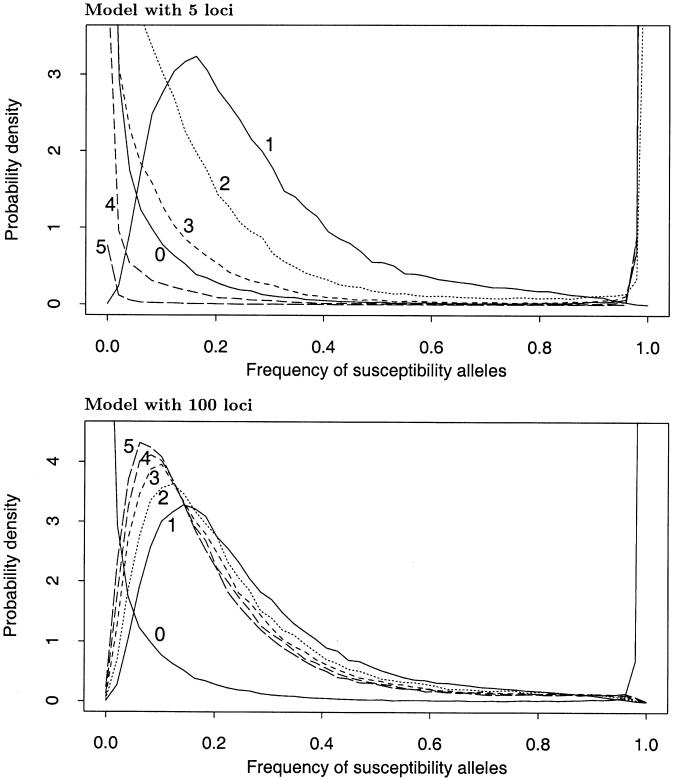
Figure 3.
Probability distributions of the overall frequency of susceptibility alleles at each locus, under the multilocus model described in the text. In each plot, the solid line labeled “0” shows the unconditional distribution of allele frequencies. The lines labeled “1”,…,“5” show the frequency distributions at the five loci that contribute the most to the sibling recurrence risk: that is, line “i” gives the frequency distribution at the locus with the ith largest value of λs. Parameters: (top) K=0.01, Λs=10.0, L=5, and  ; (bottom) K=0.0004, Λs=75.0, L=100, and
  .
.

