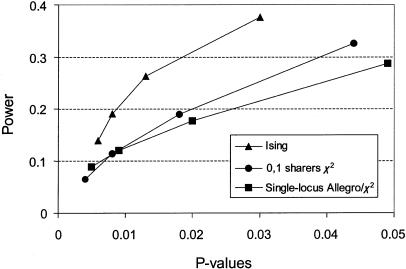
Figure 2.
Power versus type I–error rates for analysis of the two-locus genetic model. The conditional epistatic two-locus Ising model is compared with a single-locus analysis, illustrated either by the Allegro exponential pairs statistic or by a χ2 statistic (for fully informative markers, the two single-locus methods are equivalent), and with an analysis based on splitting the sample according to the IBD-sharing state at locus 1, followed by a single-locus analysis of only those sib pairs sharing 0 or 1 alleles IBD.

