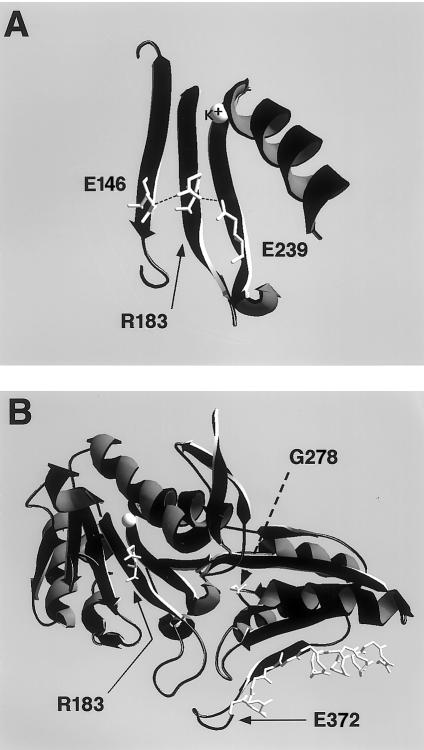
Figure 3.
Ribbon representations of portions of E1β crystal structure, showing positions of mutated residues. The E1 crystal-structure data were obtained from the NCBI Structure (Molecular Modeling Database). Swissprot-Pdb Viewer was used to generate models and image files. A, Ribbon diagram of β-sheets d, e, and g, with the side chains of E146, R183, and E239, respectively, which are shown in white. The mutated residue, R183, is indicated by the arrow, side-chain hydrogen-bond interactions are indicated by dashed lines, and the coordinated K+ ion is labeled directly. For clarity of presentation, main-chain hydrogen interactions have been omitted. B, Overview of entire molecule, except for structures overlying the sheet containing R183. The residues altered by missense mutations, R183 and G228, are indicated by bent and dashed arrows, respectively, and their side chains are shown in white. The α-carbon backbone of residues truncated by the nonsense mutation E372X are shown in white.

