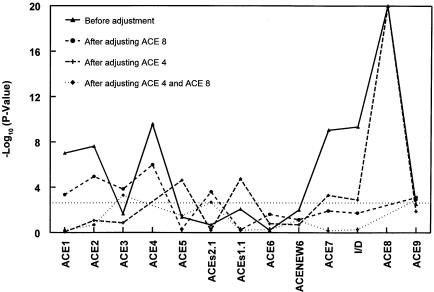
Figure 2.
Results of association analysis relating ACE concentration to variants in the ACE gene. Age and gender were entered as covariates; additive, recessive, or dominant modes of inheritance were assumed in separate analyses, but only the smallest P value among the three different modes of inheritance is reported. P values are from the likelihood-ratio test with 1 df. The dotted horizontal line represents P=.0013 (-log[.0013]=2.886), the 5%-significance level after adjustment for multiple comparisons.

