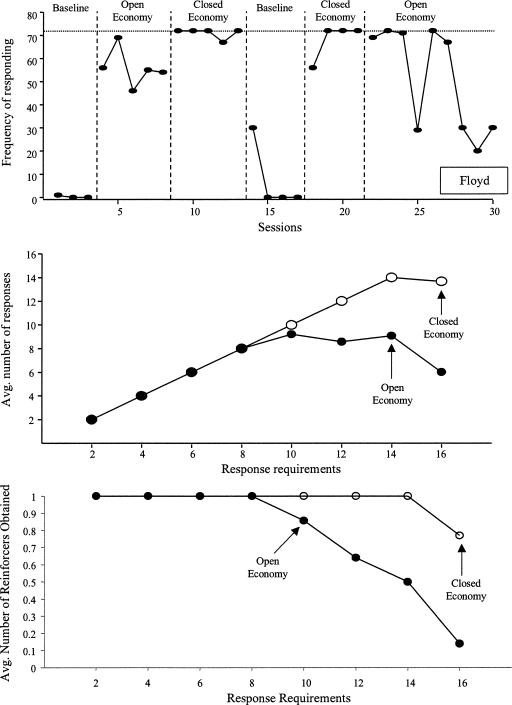
Figure 1. Frequency of responses across sessions during baseline, open economy, and closed economy (top) for Floyd.
The dashed line near the top shows the maximum number of responses that could be emitted (i.e., 72 responses in each session). Average number of responses emitted across response requirements during the open and closed economies (middle). Average amount of reinforcer consumption across response requirements during the open and closed economies (bottom).

