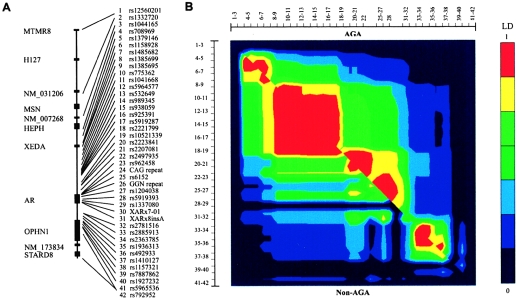
Figure 2.
Gene and LD structure of the AR locus. A, Distribution of known genes (left) and typed SNPs and STRs (right) at the AR locus. The shown genomic region spans 4.4 Mb. Gene content information is based on Ensembl. B, LD in 198 individuals with AGA (upper right diagonal) and in 157 individuals without AGA (lower left diagonal) was measured with χ2 and was visualized using the GOLD program (Abecasis and Cookson 2000).

