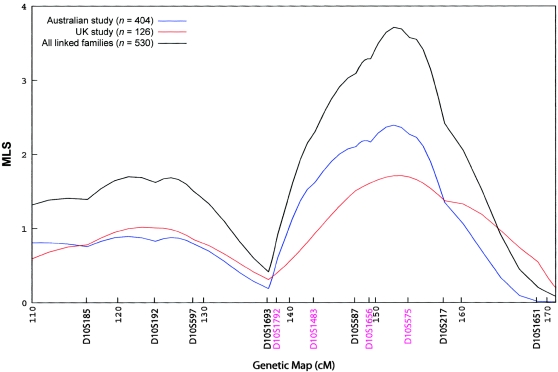
Figure 4.
Linkage in chromosome 10 conditional on linkage to chromosome 20. Chromosome 10 linkage curves are presented for families showing linkage at the chromosome 20 peak. Curves show MLS results for families linked to the chromosome 20 peak in the two studies separately and for all linked families. Microsatellite markers are shown in genetic map order along the X-axis, with positions given in cM (Haldane). The Y-axis represents the MLS.

