Figure 4.
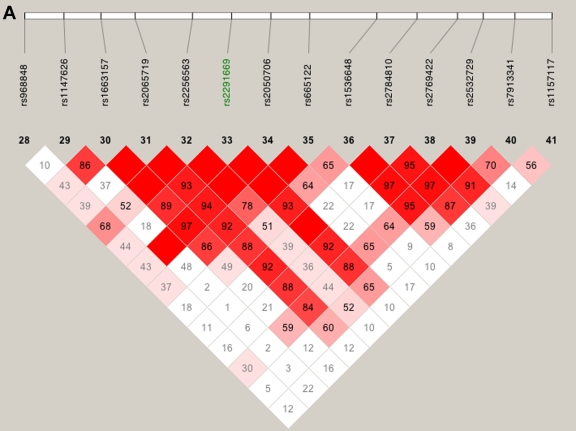
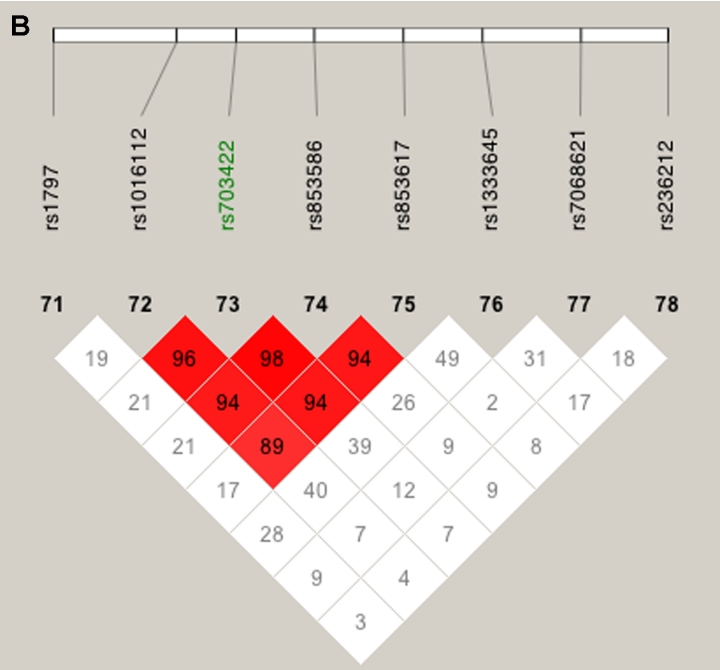
LD patterns on chromosome 10 based on analysis of 196 CIDR SNPs and 179 unrelated controls. A, The false peak at 135 cM (see fig. 3); the SNP with the largest Sall in the peak is highlighted in green. B, The false peak at 142 cM (see fig. 3); the SNP with the largest Sall in the peak is highlighted in green. C, Linkage peak. Significant SNPs, from CCREL (table 5), that overlie the five genes (GRK5, RGS10, PLEKHA1, LOC387715, and PRSS11) are highlighted in green. Squares shaded pink or red indicate significant LD between SNP pairs (bright red indicates pairwise D′=1), white squares indicate no evidence of significant LD, and blue squares indicate pairwise D′=1 without statistical significance. LD is measured using D′, and the values within the squares give pairwise LD in D′/100.


