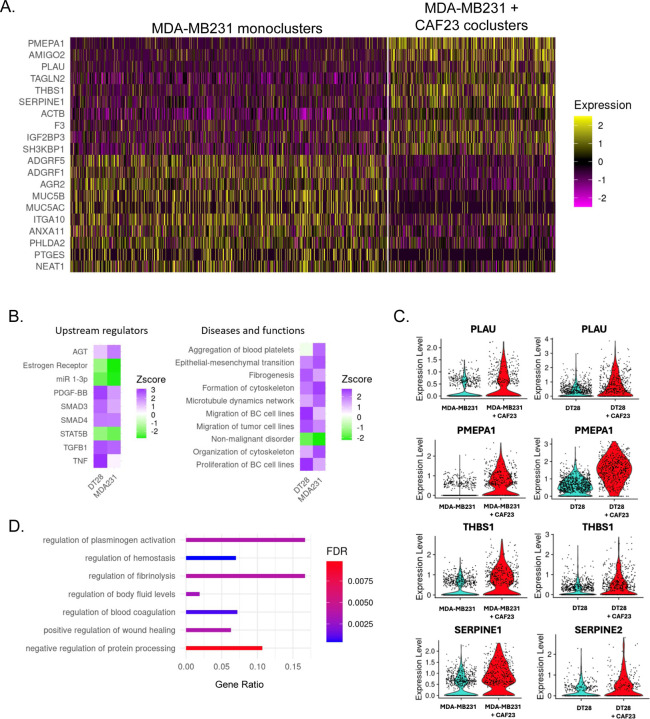
Figure 4: Single Cell RNA seq analysis of MDA-MB231 cells from MDA-MB231 mono-clusters vs CAF23/MDA-MB231 co-clusters.
A. Heatmap showing the top 10 up and down DEG in breast cancer cells from MDA-MB231 mono-clusters vs breast cancer cells from CAF23/MDA-MB231 co-clusters. Plot shows only cells that were in the G1 phase of the cell cycle; each line represents an individual cell. Number of MDA-MB231 cells analyzed: 902 cells from MDA-MB231 mono-clusters and 474 cells from CAF23/MDA-MB231 co-clusters. B. Heatmap showing top upstream regulators and top diseases/functions identified by Ingenuity Pathway Analysis (IPA) of DEG lists of breast cancer cells from mono-clusters vs co-clusters for MDA-MB231 and DT28 cell lines. The Z score indicates the likely activation (positive) or inhibition (negative) of a regulator or function; a score of 2 is considered significant. C. Violin plots from the top 4 genes upregulated in both CAF23/MDA-MB231 co-clusters and CAF23/DT28 co-clusters. Each dot represents a cell. D. Gene Ontology analysis of a ranked list of DEG from MDA-MB231 mono-clusters vs CAF23/MDA-MB231 co-clusters. Gene ratio indicates the fraction of DEG genes over the number of genes in each gene set. FDR is the adjusted p value.

