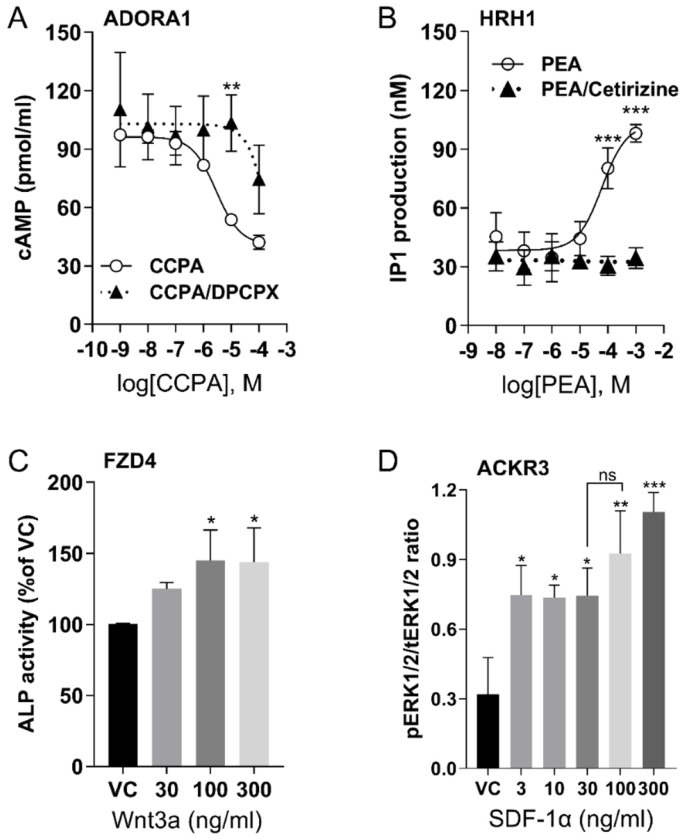
Figure 1. GPCR activation in U2OS cells by selective agonists.
(A) Dose-dependent cAMP accumulation after ADORA1 activation with agonist, CCPA, or inhibition with antagonist DPCPX (5μM). (B) Dose-dependent IP1 accumulation after PEA stimulation of HRH1 and inhibition by Cetirizine (1μM). (C) ALP activity after stimulation of FZD4 by Wnt3a. (D) The ratio of phosphorylated ERK1/2 (pERK1/2) by total ERK 1/2 (tERK1/2) after stimulation of ACKR3 by SDF-1α. For all graphs, data are shown as mean ± SD, with n=3 independent repeats, each having duplicate determinants, ns=not significant, *p < 0.05, **p < 0.01, ***p < 0.001 vs vehicle control (VC). Statistical significances were determined by one way or two-way ANOVA of receptors by agonists or antagonists and post-hoc Tukey or Sidak testing for multiple comparisons.

