
Figure 4. Hierarchical cluster image of the NF-κB dependencies of genes rescued by Wt. IKKα in IKKα(−/−) MEFs.
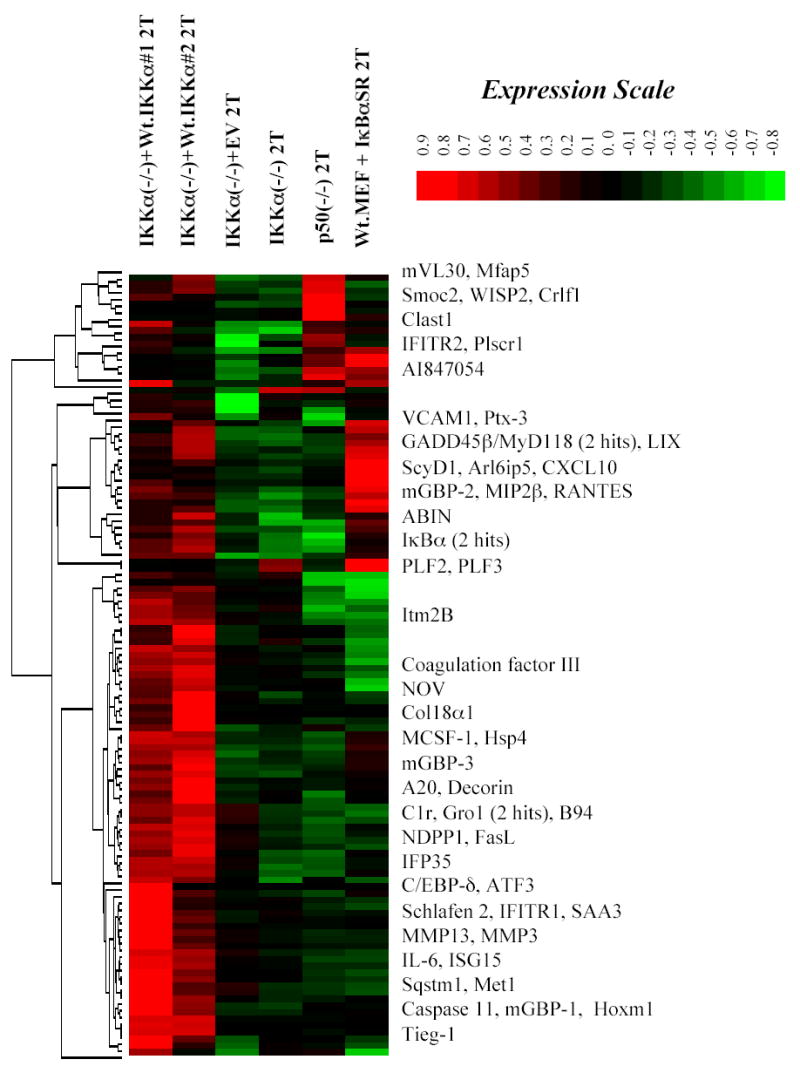
Signal values of 118 IKKα dependent genes derived from two independent microarray screens of IKKα(−/−) cells expressing Wt. IKKα (Columns 1 and 2) were subjected to hierarchical clustering in comparison to the following samples: Column 3: IKKα(−/−) MEFs+ empty vector (EV) 2T, Column 4: IKKα(−/−) MEFs 2T, Column 5: p50(−/−) 2T and Column 6: Wt. MEFs + IκBα(S32A, S36A) 2T. The 118 IKKα dependent genes employed in these comparisons were selected on the basis of average fold change values of 1.5 or greater (minimum of 1.3 fold each) and difference calls of “increase” or “marginal increase” in two independent samples of 2 hr TNFα (2T) stimulated IKKα(−/−) MEF + Wt.IKKα 2T vs. IKKα(−/−) MEF + empty vector (EV) 2T MEFs. The locations of a number of genes are indicated. Signal values were all derived from MAS5.0 calculation and normalized as described in Experimental Procedures. Gene expression values are shown in color according to the indicated expression scale bar.