
Figure 6. Hierarchical cluster image of genes rescued by Wt. IKKα in comparison to an IKKα(K44M) mutant.
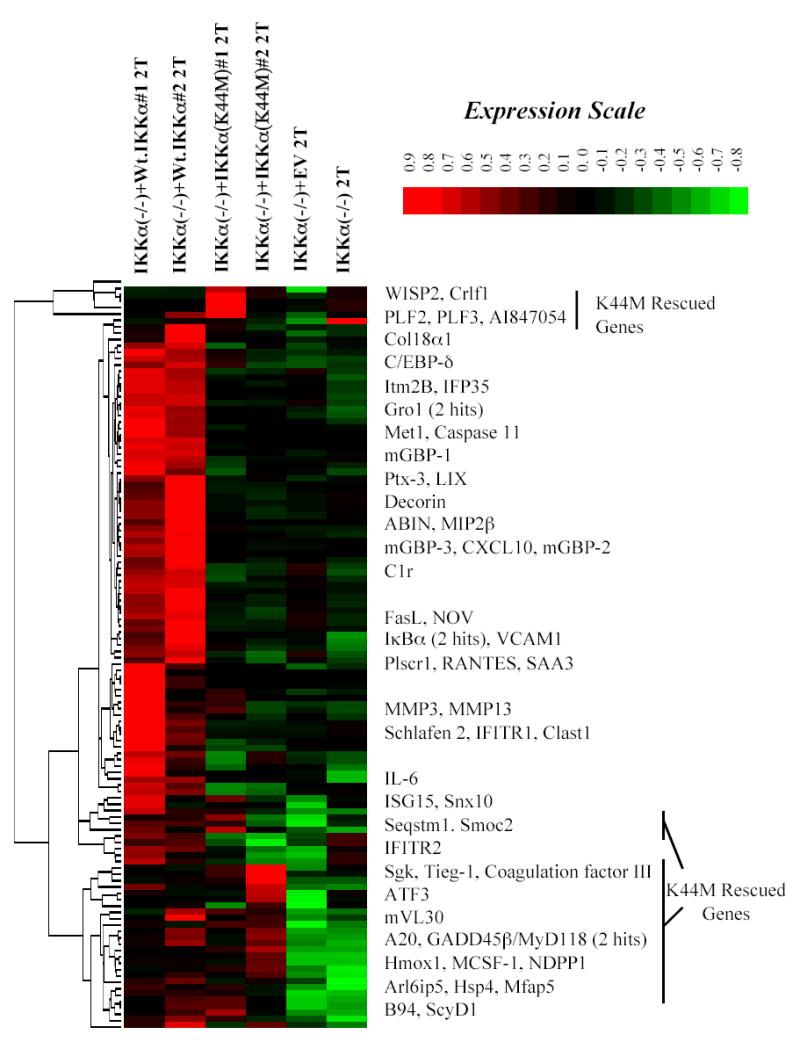
Signal values of the 118 genes rescued by Wt. IKKα in duplicate screens (columns 1 and 2) were evaluated by hierarchical clustering (as described in Figure 3) in comparison to their signal values in duplicate screens of 2 hr TNFα (2T) stimulated IKKα (−/−) MEFs expressing a kinase inactive IKKα(K44M) mutant (columns 3 and 4). As in Figure 4, the IKKα specificities of the rescues can be visualized in columns 5 and 6, which display the signal values of the 118 genes in IKKα(−/−) null MEFs or the same cells expressing an empty retroviral (EV).