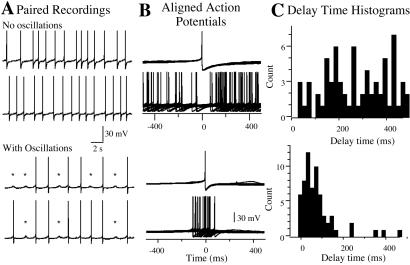
Figure 2.
Synchronous action potentials are found in pairs of neurons having oscillations. (A) Paired recordings from neurons without (upper two traces) and with (lower two traces) subthreshold oscillations. Note subthreshold oscillation marked by *. (B) The action potentials in one neuron were aligned to the trace from the other cell. Action potentials in neuron 1 were set to time 0 and the time to the peak of action potential in neuron 2 (Δt) was determined. (C) Frequency histogram of Δt for each pair. The mean Δt for each histogram was calculated from the cumulative frequency plot obtained by integrating the frequency histogram. Note the different distribution.

