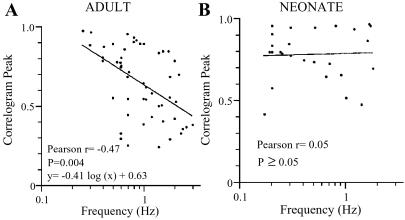
Figure 5.
Correlation between frequency and synchrony in adult LC. (A) In slices from adults, the frequency of the subthreshold oscillations correlates with the degree of synchrony (Pearson r = −0.47, P = 0.004). Pooled data from 31 pairs (n = 52) are plotted and the logarithmic equation y = −0.41⋅log(x) + 0.63 fits the data. (B) In neonatal slices, data from 13 pairs (n = 6) were pooled and no correlation was found (Pearson r = 0.05, P ≥ 0.05). The logarithmic equation y = 0.02⋅log(x) + 0.79 fits the data.

