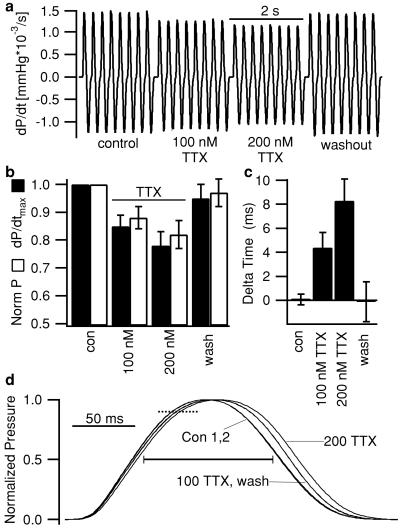
Figure 5.
Effect of TTX on myocardial contractility in isolated working guinea pig hearts. (a) Representative tracing of left ventricular isovolumic contractile performance (dP/dt) from a guinea pig heart under control conditions, in the presence of 100 or 200 nM TTX and after washout (n = 4). (b) Fractional change in maximal rate of left ventricular pressure development (dP/dtmax, ■) and in left ventricular developed pressure (P, □) caused by TTX relative to control conditions (n = 4). (c) Difference in mean time from stimulus to 90% of peak pressure compared with control [Delta time; see dotted line (d), n = 7]. This measure varied by 0.1 ± 0.4 ms (n.s.) between two control periods but increased by 4.4 ± 1.2 ms (P < 0.01 vs. control) and 8.3 ± 1.8 ms (P < 0.001) in 100 and 200 nM TTX, respectively. Washing reversed TTX effects (−0.1 ± 1.7 ms vs. control; n.s.). (d) Mean pressure traces obtained during two control periods (Con 1,2), in the presence of 100 or 200 nM TTX and after washout of TTX from a representative experiment where each trace was rescaled to match the control amplitude. Each mean trace was constructed from 10 consecutive beats. In the same experiments, the duration of systole at 50% of peak pressure (solid bar) increased from 117.8 ± 2.4 ms in control to 122.3 ± 2.4 ms (P < 0.01) and 126.5 ± 2.4 ms (P < 0.01) in 100 and 200 nM TTX, respectively, and was reversed on TTX washout (119.6 ± 1.4 ms, n.s., n = 7). Cycle length was maintained constant at 250 ms. Error bars represent ± SEM.

