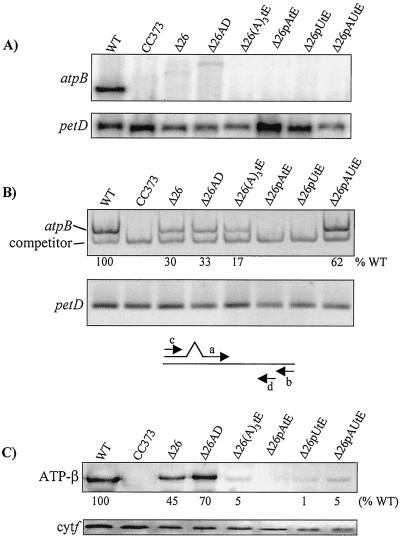
Figure 3.
Analysis of transformants containing modified atpBΔ26 genes (see Fig. 1B). CC373 is an atpB deletion mutant and was the transformation recipient. (A) RNA filter hybridizations, with petD as a loading control. The weak signals in the Δ26 and Δ26AD lanes correspond to low-abundance atpB transcripts, most likely stabilized by sequences in the downstream aadA cassette. (B) RT-PCR analysis of transcript accumulation in the same strains as in A. Equal amounts of RNA were analyzed by using competitive RT-PCR for atpB, or RT-PCR under the same conditions for petD-coding regions (see Materials and Methods). Relative atpB RNA accumulation is an average of two experiments. Control PCR reactions were also conducted on RNA samples with RT being omitted. In these cases, no amplification product was observed (data not shown). Below the gel pictures, a schematic of the competitive RT-PCR strategy is shown (see text). Primers a and b were used to create a template for synthesis of competitor RNA, and primers c and d were used for RT-PCR. (C) Immunoblot analysis of the same strains, with cytochrome f as a loading control. The estimated accumulation of the atpB gene product, relative to the wild-type control, is shown beneath the blot, and is an average of at least three experiments. The basis for quantitation is given in Materials and Methods.

