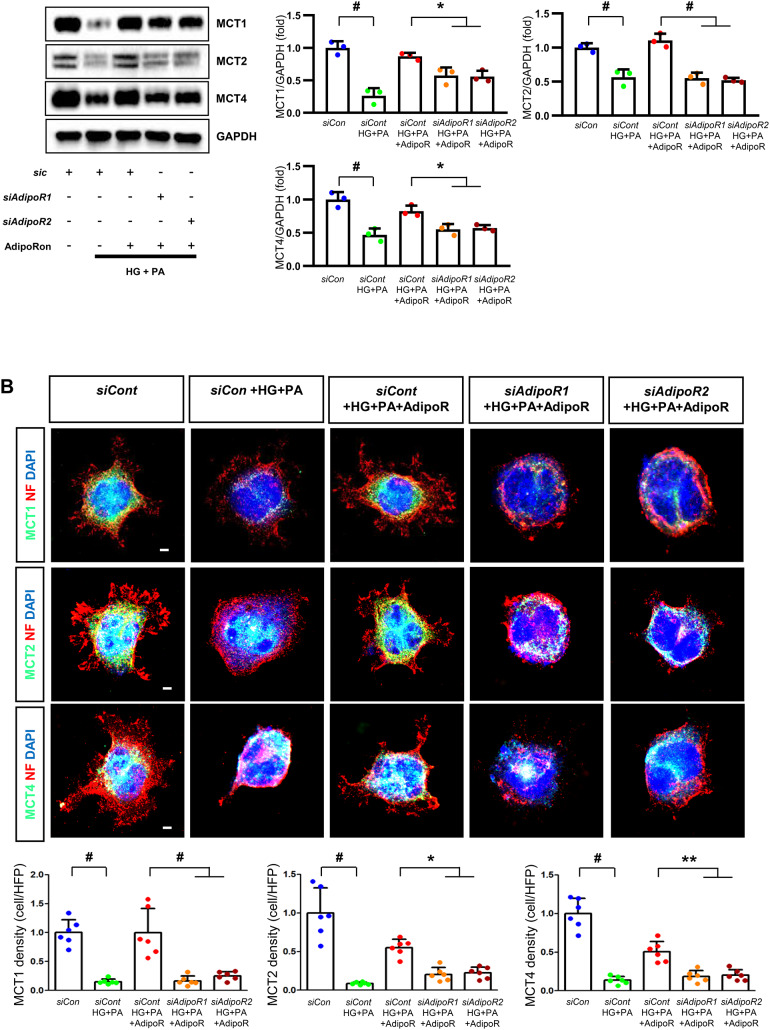
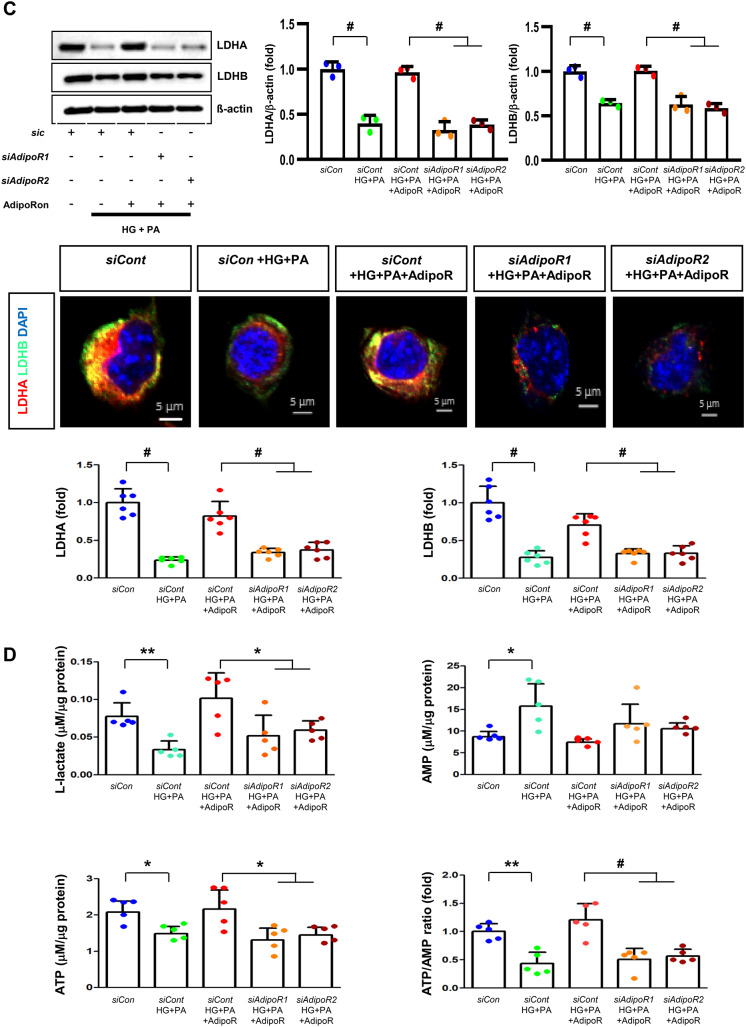
Fig. 4.
Effect of AdipoRon on signaling pathways in ND7/23 cells (murine DRG neuronal cell). ND7/23 cells were transfected with adipoR1 or adipoR2 siRNA and cultured in low- or high-glucose (HG) and palmitate (PA) medium, with or without AdipoRon treatment. (A) Representative western blot images showing the expression of AdipoR1, AdipoR2, CaMKKα and β, pLKB1/total LKB1, pAMPK/total AMPK, p-mTOR/total mTOR, PGC-1α, PPARα, Bax/Bcl-2, LC3II/LC3I ratios, MCT1, MCT2, MCT4, GAPDH, cytoplasmic Nrf2, nuclear Nrf2, and lamin (B). Quantitative analyses of protein expression levels in each group are shown (n = 3). (B) Representative images of double IF staining for MCT1, MCT2, and MCT4 (green) with NF (white, axonal marker) are shown with corresponding quantitative analyses (n = 6). (C) Representative western blot (n = 3) and double IF images (n = 6) for LDHA (red) and LDHB (green) expression, with quantitative analyses. (D) Quantitative measurements of intracellular lactate, AMP, and ATP levels, and ATP/AMP ratio (n = 5). (E) Representative sections stained with Fluo-4AM (green, intracellular Ca++), DHE (red, cellular oxidative stress), MitoSox (red, mitochondrial oxidative stress), TUNEL (green, apoptosis), and LC3 (green, autophagy). Quantitative analyses of positive areas and density are shown for each group. Data are presented as the mean ± SD (n = 6). (F) Representative double IF staining images of MCT1, MCT2, MCT4 (green) and MitoSOX (red) in ND7/23 cells under different conditions (n = 6). (G) Quantitative measurements of intracellular lactate, ATP and AMP concentrations and ATP/AMP ratios in SCs and ND7/23 cells in low glucose (LG), high glucose and palmitate (HG + PA), and high glucose and palmitate treated with adiopoRon (HG + PA + adipoR), respectively (n = 5). *P < 0.05, **P < 0.01, and #P < 0.001, compared with other groups. Scale bars in (B, C, E and F) represent 5 μm


