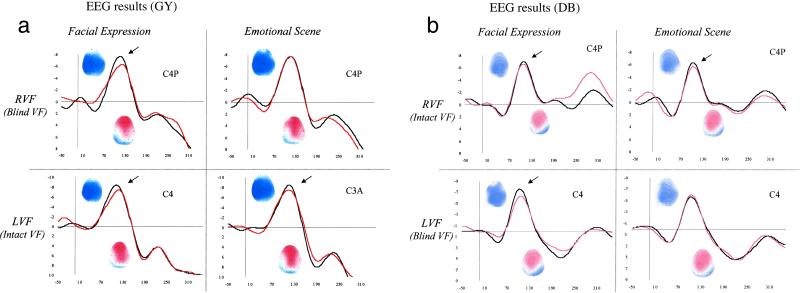
Figure 2.
The x axis represents the time in ms (from −50 ms before auditory stimulus onset to 310 ms after stimulus onset). The y axis represents the amplitude in μV from −8 μV to +8 μV. Grand averaged auditory waveforms and corresponding topographies (horizontal axis) at central electrodes in each visual condition (congruent pairs in black, incongruent pairs in red) and for each visual hemifield are shown. For each topographical map (N1 and P2 components), the time interval is 20 ms and the amplitude scale goes from −6 μV (in blue) to +6 μV (in red).

