

Abstract
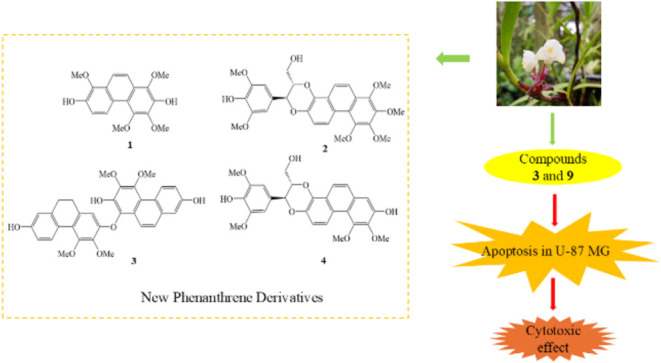
A detailed phytochemical investigation was carried out on the whole plant of Cylindrolobus mucronatus, representing the first scientific study of this species. The research identified 11 compounds, including four newly discovered structures, cymucronins A-D (1–4), and seven previously known compounds (5–11). The structures of the new compounds were determined using advanced spectroscopic methods, such as nuclear magnetic resonance (NMR) and mass spectrometry. The cytotoxic activities of isolated compounds (1–3, 5–9) were tested against the U-87 MG glioma cell line. The half-maximal inhibitory concentrations (IC50) of compounds 3 and 9 were 19.91 ± 4.28 and 17.08 ± 3.72 μM, respectively, indicating the potential of C. mucronatus as a valuable source of cytotoxic natural products. This study provides significant insights into the phytochemical and pharmacological properties of C. mucronatus, supporting its potential for further exploration in anticancer medicinal research.

Introduction
Cancer remains one of the most significant global health challenges, ranking as the second leading cause of death worldwide after cardiovascular diseases. Each day, over 52,900 individuals are diagnosed with cancer, and more than 27,000 die from the disease. Specific examples include cervical cancer, which caused 259,671 deaths, and brain and nervous system cancers, responsible for 247,143 deaths globally. Current treatment strategies typically involve a combination of surgical tumor removal, radiotherapy, chemotherapy, and occasionally targeted therapies. Among these, chemotherapy plays a central role, particularly when combined with surgery or radiation. Given that cytotoxic drugs form the foundation of chemotherapy, identifying new cytotoxic compounds with broad-spectrum efficacy, innovative mechanisms of action, and reduced toxicity remains critically important. −
Medicinal orchids have been integral to traditional medicine for their therapeutic properties, with numerous phytochemicals, including alkaloids, flavonoids, and phenanthrenes, identified in these plants. − These compounds exhibit a range of biological activities, such as antimicrobial, anti-inflammatory, and anticancer effects. Research on various orchid species has revealed several isolated compounds with cytotoxic activity, positioning them as potential candidates for anticancer drug development. ,, Notable examples include erianthridin, ovalitenone, lusianthridin, dendrosignatol, and gigantol, which have shown significant anticancer effects in studies. − The identification and chemical modification of active molecules from orchids offer opportunities to develop novel anticancer drugs capable of inhibiting cancer cell growth. As cancer and other diseases increasingly develop resistance to existing treatments, the discovery of new natural products remains essential.
As part of our ongoing research on bioactive compounds from orchids, , we investigated the chemical constituents from the whole plant of Cylindrolobus mucronatus, a species within the Orchidaceae family that remains largely unexplored regarding its phytochemical and pharmacological properties. While the Cylindrolobus genus is primarily recognized for its ornamental value, limited attention has been given to its bioactive compounds. This lack of research underscores the need for a thorough study to explore the plant’s chemical composition and potential medicinal benefits. The ethyl acetate extract from the whole plants of Cylindrolobus mucronatus showed notable cytotoxic effects against U-87 MG glioma cells, leading us to explore the plant for potential cytotoxic compounds.
Results and Discussion
Eleven compounds were isolated from the ethyl acetate extract of Cylindrolobus mucronatus, comprising four newly identified compounds, cymucronins A-D (1–4), and seven previously known ones (Figure ). The structural elucidation of these molecules was achieved using advanced nuclear magnetic resonance (NMR) spectroscopy, complemented by mass spectrometry. The known compounds include confusarin (5), nudol (6), erianthridin (7), coelonin (8), bleformin I (9), (2,3-trans)-2-(4-hydroxy-3-methoxyphenyl)-3-hydroxymethyl-10-methoxy-2,3,4,5-tetrahydrophenanthro [2,1-b] furan-7-ol (10), and blestriarene C (11). This study enriches the phytochemical profile of C. mucronatus, highlighting its potential as a source of bioactive secondary metabolites. Preliminary evaluations suggest significant promise for therapeutic applications, particularly in the treatment of glioblastoma.
1.

Structures of compounds 1-11 isolated from Cylindrolobus mucronatus.
Compound 1 was obtained as a brown amorphous solid. Its molecular formula was determined to be C18H18O6, based on the HR-ESI-MS analysis, which revealed an [M-H] – ion peak at m/z 329.1036 (calcd. for 329.1025, C18H17O6 –). The IR spectrum showed characteristic absorption bands associated with hydroxyl groups (3391 cm–1) and aromatic ring vibrations (2922 and 1610 cm–1). The UV spectral data exhibited absorption maxima at 215, 270, and 315 nm, consistent with the presence of a phenanthrene framework, as previously reported. This structural assignment was further supported by the 1H NMR spectrum, which displayed two ortho-coupled doublet protons corresponding to H-9 (δH 7.92, 1H, d, J = 9.2 Hz) and H-10 (δH 8.06, 1H, d, J = 9.2 Hz). The 13C NMR spectrum confirmed the presence of 14 aromatic carbons, along with four methoxy groups (Table ). Additionally, the 1H NMR spectrum showed signals for four aromatic protons within the range of δ 7.32–9.24, two hydroxyl protons at δ 5.80 (HO-7) and 5.91 (HO-2), and for four methoxy groups at δ 4.04 (3H, s, MeO-1), 4.15 (3H, s, MeO-3), 3.96 (3H, s, MeO-4), and 4.00 (3H, s, MeO-8).
1. 1H (400 MHz) and 13C NMR (100 MHz) Spectral Data of Compound 1 in CDCl3 .
| Position | δH (J in Hz) | δC, type |
|---|---|---|
| 1 | 138.1, C | |
| 2 | 139.9, C | |
| 3 | 141.6, C | |
| 4 | 147.2, C | |
| 4a | 118.3, C | |
| 4b | 124.8, C | |
| 5 | 9.24, d (9.6) | 124.2, CH |
| 6 | 7.32, d (9.6) | 116.1, CH |
| 7 | 145.6, C | |
| 8 | 140.9, C | |
| 8a | 126.5, C | |
| 9 | 7.92, d (9.2) | 119.2, CH |
| 10 | 8.06, d (9.2) | 120.6, CH |
| 10a | 123.0, C | |
| MeO-1 | 4.04, s | 61.5, CH3 |
| MeO-3 | 4.15, s | 61.4, CH3 |
| MeO-4 | 3.96, s | 59.7, CH3 |
| MeO-8 | 4.00, s | 62.0, CH3 |
| HO-2 | 5.91, br s | - |
| HO-7 | 5.80, br s | - |
For ring A, the first methoxy group (δ 4.04) was assigned to C-1, based on its NOESY interaction with H-10 and OH-2. The second methoxy group (δ 4.15) was positioned at C-3, as indicated by its NOESY correlation with OH-2 and the HMBC correlation between MeO-3 and C-3. The third methoxy group (δ 3.96) corresponded to C-4, supported by its NOESY interaction with H-5. Quaternary carbon C-1 was established through its HMBC correlation with H-10. The presence of the hydroxyl group at C-2 (δC 139.9) on ring A was further corroborated by the HMBC correlation of C-1 (δC 138.1) with HO-2.
In ring B, the 1H NMR spectrum displayed two ortho-coupled doublets at δH 7.32 (1H, d, J = 9.6 Hz, H-6) and δH 9.24 (1H, d, J = 9.6 Hz, H-5). The assignment of H-6 was supported by its HMBC with C-4b (δC 124.8), while the position of H-5 was confirmed through the HMBC correlations with C-4a (δC 118.3) and C-8a (δC 126.5) (Figure ). One methoxy group (δ 4.00) was assigned to C-8, as indicated by its NOESY correlations with H-9. The presence of the hydroxyl group at C-7 (δC 145.6) on ring B was further corroborated by the HMBC correlation of C-8 (δC 140.9) with OH-7 and the NOESY crosspeak between HO-7 and MeO-8 (Figure ). Based on these spectroscopic findings, the structure of compound 1 was elucidated, and named cymucronin A.
2.

Key COSY () and HMBC (↷) correlations of compounds 1–4.
3.

Key NOESY correlations of compounds 1–4.
Compound 2 was obtained as a brown amorphous solid. Its molecular formula C29H30O10 was based on its [M-H] – ion peak at m/z 537.1753 (calcd. for 537.1760, C29H29O10 –). The IR spectrum displayed absorption bands characteristic of hydroxyl groups (3393 cm–1) and aromatic ring functionalities (2918 and 1613 cm–1). The UV data indicated absorption maxima at 205, 265, and 319 nm, consistent with a phenanthrene core structure. The presence of a phenanthrene skeleton was confirmed by the 1H NMR spectrum, which displayed two ortho-coupled doublet signals of H-9 (δH 8.17, 1H, d, J = 9.2 Hz) and H-10 (δH 8.04, 1H, d, J = 9.2 Hz). The 13C NMR and HSQC spectra revealed 20 aromatic carbons, two oxygenated methine carbons, one oxygenated methylene carbon, along with six methoxy groups (Table ). Additionally, the 1H NMR spectrum exhibited eight proton signals within the range of δ 3.94–9.11 and six methoxy group signals at δ 4.02 (3H, s, MeO-1), 4.05 (3H, s, MeO-2), 4.07 (3H, s, MeO-3), 3.96 (3H, s, MeO-4), and 3.89 (6H, s, MeO-3′ and MeO-5′).
2. 1H (400 MHz) and 13C NMR (100 MHz) Spectral Data of Compounds 2 and 4 in Acetone-d 6 .
| compound 2
|
compound 4
|
|||
|---|---|---|---|---|
| position | δH (J in Hz) | δC, type | δH (J in Hz) | δC, type |
| 1 | 145.0, C | 7.21, s | 108.9, CH | |
| 2 | 144.5, C | 149.5, C | ||
| 3 | 147.1, C | 142.1, C | ||
| 4 | 148.1, C | 151.7, C | ||
| 4a | 120.8, C | 118.1, C | ||
| 4b | 124.3, C | 124.8, C | ||
| 5 | 9.11, d (9.2) | 120.1, CH | 9.04, d (9.6) | 119.3, CH |
| 6 | 7.26, d (9.2) | 117.1, CH | 7.23, d (9.6) | 116.9, CH |
| 7 | 140.7, C | 140.0, C | ||
| 8 | 137.5, C | 137.6, C | ||
| 8a | 123.9, C | 122.9, C | ||
| 9 | 8.17, d (9.2) | 119.0, CH | 8.10, d (9.2) | 119.1, CH |
| 10 | 8.04, d (9.2) | 119.6, CH | 7.61, d (9.2) | 126.0, CH |
| 10a | 123.3, C | 129.8, C | ||
| 1′ | 127.3, C | 127.4, C | ||
| 2′, 6′ | 6.91, s | 105.3, CH | 6.91, s | 105.3, CH |
| 4′ | 136.5, C | 136.5, C | ||
| 3′, 5′ | 148.0, C | 148.0, C | ||
| 7′ | 5.11, d (8.0) | 76.7, CH | 5.08, d (8.0) | 76.7, CH |
| 8′ | 4.33, m | 79.0, CH | 4.30, m | 79.0, CH |
| 9′ | 3.94, m | 61.2, CH2 | 3.92, m | 61.2, CH2 |
| 3.72, m | 3.70, m | |||
| MeO-1 | 4.02, s | 61.0, CH3 | ||
| MeO-2 | 4.05, s | 60.7, CH3 | ||
| MeO-3 | 4.07, s | 60.9, CH3 | 4.03, s | 60.4, CH3 |
| MeO-4 | 3.96, s | 59.6, CH3 | 3.99, s | 59.3, CH3 |
| MeO-3′, 5′ | 3.89, s | 55.9, CH3 | 3.89, s | 55.9, CH3 |
Assignment was interchangeable.
On ring A of phenanthrene nucleus, four additional methoxy groups were assigned to C-1, C-2, C-3, and C-4, based on the correlations observed between MeO-1, MeO-2, MeO-3, MeO-4 and C-1, C-2, C-3, C-4, respectively, in the HMBC spectrum. These positions were further corroborated by NOESY correlations between H-10 and MeO-1, as well as between H-5 and MeO-4.
For ring B of phenanthrene skeleton, the 1H NMR spectrum displayed two ortho-coupled doublets corresponding to H-5 (δH 9.11, 1H, d, J = 9.2 Hz) and H-6 (δH 7.26, 1H, d, J = 9.2 Hz). The assignment of H-6 was supported by HMBC correlations with C-4b (δ C 124.3) and C-8 (δC 137.5), while the position of H-5 was confirmed through HMBC correlations with C-4a (δC 120.8) and C-8a (δC 123.9). The presence of a phenylpropane group was supported by the HMBC cross-peak of the carbon at C-7′ (δC 76.7) with aromatic protons of H-2′ and H-6′ (δH 6.91, 2H, s), and H-8′ (δH 4.33, 1H, m). Two methoxy groups were assigned to C-3′ and C-5′ based on HMBC correlations between MeO-3′ and C-3′, as well as between MeO-5′ and C-5′. Additional NOESY correlations further validated the substitution pattern between MeO-3′ and H-2′, and between MeO-5′ and H-6′.
In ring C, a detailed examination of the COSY and HSQC spectra (Figure ) yielded structural fragments (C-7′ to C-9′). The spectra indicated the presence of an oxygenated methylene group at δH 3.94 (1H, m, H-9′a) and 3.72 (1H, m, H-9′b). A deshielded doublet at δH 5.11 (d, J = 8.0 Hz, H-7′) suggested a benzylic methine substituted with an oxygen atom, along with a multiplet at δH 4.33 (1H, m, H-8′), which exhibited coupling between these protons, implying the existence of a dioxin ring. It was proposed that the phenylpropane unit connect to phenanthrene nucleus through ether bonds between C-7 and C-7′, and C-8 and C-8′ to form dioxin ring, as evidenced by the HMBC correlation showing a cross-peak for H-7′ to C-7 (δC 140.7) and H-9′b to C-8 (δC 137.5) with a reduced J value of 4 Hz. −
Furthermore, the position of H-7′ was corroborated by its two-bond HMBC correlation of H-7′ to C-1′, NOESY correlation with H-6′ and H-8′, while the placement of H-8′ was validated through its NOESY correlation with H-9′b. The relative configuration of H-7′ and H-8′ was established as trans, based on the coupling constant (J = 8 Hz) and NOESY correlations between H-8′ and H-2′, which indicated that H-2′ and the phenylpropane group lie in the same plane. The absolute configurations of the chiral centers were determined by comparing the experimental electronic circular dichroism (ECD) spectra of dendrocandin P1. Compound 2 exhibited a similar trend of a negative Cotton effect around 270 nm (Δε = −0.64). These findings suggest that the absolute configuration of this compound is the S, S configuration. Based on this comprehensive spectral analysis, the structure of this new phenanthrene derivative, compound 2 was elucidated as cymucronin B.
Compound 3 was obtained as a brown amorphous solid. The molecular formula, C32H28O8, was determined using HR-ESI-MS, which revealed an [M + H] + ion at m/z 541.1857 (calcd. for 541.1862, C32H29O8 +). The IR spectrum exhibited characteristic absorption bands associated with hydroxyl groups (3372 cm–1) and aromatic rings (2926 and 1611.82 cm–1). UV absorptions at 215 and 265 nm were indicative of a phenanthrene nucleus.
The 13C NMR and HSQC spectra displayed signals of twenty-six aromatic carbons and two methylene carbons, indicating a dimeric phenanthrene-dihydrophenanthrene structure (Table ). The 1H and 13C NMR resonances of one dihydrophenanthrene unit (rings A, B, and C) showed similarities to erianthridin (7), while those of the second phenanthrene unit (rings A′, B′, and C′) resembled nudol (6). Both monomers were also isolated from this plant. This observation was supported by the presence of two ortho-coupled doublets in the 1H NMR spectrum at δH 7.73 (1H, d, J = 9.1 Hz, H-10′) and δH 7.54 (1H, d, J = 9.1 Hz, H-9′). Additionally, the signals of two methylene carbons at C-9 (δC 30.6) and C-10 (δC 30.7) supported the presence of a 9,10-dihydrophenanthrene structure.
3. 1H (600 MHz) and 13C NMR (150 MHz) Spectral Data of Compound 3 in Acetone-d 6 .
| position | δH (J in Hz) | δC, type |
|---|---|---|
| 1 | 6.13, s | 110.4, CH |
| 2 | 151.6, C | |
| 3 | 142.4, C | |
| 4 | 152.7, C | |
| 4a | 122.9, C | |
| 4b | 125.0, C | |
| 5 | 8.12, d (8.6) | 129.5, CH |
| 6 | 6.73, dd (8.6, 2.5) | 114.2, CH |
| 7 | 157.1, C | |
| 8 | 6.66, d (2.5) | 115.3, CH |
| 8a | 140.5, C | |
| 9 | 2.53, m | 30.6, CH2 |
| 10 | 2.40, m | 30.7, CH2 |
| 10a | 134.6, C | |
| 1′ | 133.6, C | |
| 2′ | 142.6, C | |
| 3′ | 143.6, C | |
| 4′ | 149.7, C | |
| 4a′ | 118.8, C | |
| 4b′ | 124.2, C | |
| 5′ | 9.39, d (9.1) | 129.3, CH |
| 6′ | 7.22, dd (9.1, 2.7) | 118.1, CH |
| 7′ | 156.3, C | |
| 8′ | 7.25, d (2.7) | 112.6, CH |
| 8a′ | 134.8, C | |
| 9′ | 7.54, d (9.1) | 127.8, CH |
| 10′ | 7.73, d (9.1) | 120.9, CH |
| 10a′ | 124.2, C | |
| MeO-3 | 4.10, s | 61.4, CH3 |
| MeO-4 | 3.81, s | 60.8, CH3 |
| MeO-3′ | 4.06, s | 61.6, CH3 |
| MeO-4′ | 4.00, s | 60.4, CH3 |
For the dihydrophenanthrene unit of ring A, the assignments for H-1 (1H, δH 6.13, s), MeO-3 (3H, δH 4.10, s), and MeO-4 (3H, δH 3.81, s) were consistent with the HMBC correlations observed for C-10 (δC 30.7), C-3 (δC 142.4), and C-4 (δC 152.7) (Figure ), respectively, as well as the NOESY correlations between MeO-3 and H-10′ and between MeO-4 and H-5 (Figure ). The 1H NMR spectrum of 3 indicated structural similarities to erianthridin (7), highlighted by an ABM spin system of H-5 (δH 8.12, 1H, d, J = 8.6 Hz), and H-6 (δH 6.73,1H, dd, J = 8.6, 2.5 Hz) and H-8 (δH 6.66, 1H, d, J = 2.5 Hz) in ring B. The assignment of H-6 was corroborated by its HMBC correlation with C-4b (δC 125.0), while the position of H-5 was confirmed through HMBC correlations with C-4a (δC 122.9) and C-8a (δC 140.5).
In the phenanthrene unit of ring B′, the presence of two methoxy groups at C-3′ and C-4′ is indicated by HMBC correlations between MeO-3′ and C-3′ and between MeO-4′ and C-4′, which are further supported by NOESY correlation between MeO-4′ and H-5′. The 1H NMR spectrum demonstrated structural similarities with nudol (6), as evidenced by the two ortho-coupled doublets of H-9′ and H-10′. The assignment of H-9′ was confirmed through HMBC correlations with C-8′ (δC 112.6), C-4b′ (δC 124.2), and C-10a′ (δC 124.2), while H-10′ was positioned based on HMBC correlations with C-4a′ (δC 118.8) and C-1′ (δC 133.6).
In ring A′, the 1H NMR spectrum displayed an ABM splitting system at δ 9.39 (1H, d, J = 9.1 Hz, H-5′), 7.22 (1H, dd, J = 9.1, 2.7 Hz, H-6′) and 7.25 (1H, d, J = 2.7 Hz, H-8′). The assignment of H-6′ was supported by its HMBC correlation with C-4b′ (δC 124.2), while the position of H-5′ was confirmed through HMBC correlations with C-4a′ (δC 118.8) and C-8a′ (δC 134.8).
The two phenanthrene and dihydrophenanthrene units were connected through a C–O–C linkage between C-2 and C-1′, involving oxygenated aromatic quaternary carbons. This linkage was confirmed by the downfield chemical shift of the quaternary aromatic carbon at C-1′ (δC 133.6) and supported by the molecular formula. Through detailed spectral analysis, compound 3 was characterized as a new biphenanthrene derivative, and the trivial name cymucronin C was assigned to it.
Compound 4 was isolated as a brown amorphous solid. The molecular formula C27H26O9 was established by HR-ESI-MS, with an [M + H] + ion observed at m/z 495.1667 (calcd. for 495.1655, C27H27O9 +). The IR spectrum displayed absorption bands of hydroxyl groups (3357 cm–1) and aromatic rings (2920 and 1611 cm–1). The UV spectral analysis revealed absorption peaks at 205, 270, 315, 350, and 370 nm, consistent with a phenanthrene nucleus.
The phenanthrene backbone was further substantiated by the 1H NMR spectrum, which exhibited two ortho-coupled doublets at δH 8.10 (1H, d, J = 9.2 Hz, H-9) and δH 7.61 (1H, d, J = 9.2 Hz, H-10) (Table ). Additionally, three aromatic protons of the phenanthrene ring were resonated at δH 7.21 (1H, s, H-1), 7.23 (1H, d, J = 9.6 Hz, H-6), and 9.04 (1H, d, J = 9.6 Hz, H-5). Comparison of the 1H and 13C NMR data of compound 4 with those of compound 2, revealed a similar structure in the phenylpropane unit. This was supported by the presence of the 1H NMR signals at δ 6.91 (2H, s, H-2′, H-6′), 5.08 (1H, d, J = 8.0 Hz, H-7′), 4.30 (1H, m, H-8′), 3.92 (1H, m, H-9′a), 3.70 (1H, m, H-9′b). In addition, four methoxy groups appeared at δH 4.03 (3H, s, MeO-3), δH 3.99 (3H, s, MeO-4), and δH 3.89 (6H, s, MeO-3′, MeO-5′).
In ring A, the presence of a methoxy group on C-3 was established through HMBC correlations of C-3 with MeO-3 and H-1 (Figure ). The location of MeO-4 was supported by a NOESY interaction between MeO-4 and H-5. The assignment of H-1 was based on HMBC correlation with C-10 (δC 126.0). The HMBC spectrum validated the assignments for H-5 and H-6 in ring B, with H-6 correlating to C-4b (δC 124.8) and C-8 (δC 137.6), while H-5 correlated with C-4a (δC 118.1) and C-8a (δC 122.9).
The presence of a phenylpropane group was confirmed by the HMBC cross-peak of H-2′/H-6′ (δH 6.91, 2H, s) to C-7′ (δC 76.7). Two methoxy groups were assigned to C-3′ and C-5′ based on HMBC correlations between MeO-3′ and C-3′, and between MeO-5′ and C-5′. Further NOESY correlations supported the substitution pattern between MeO-3′ and H-2′, as well as between MeO-5′ and H-6′ (Figure ). In ring C, detailed analysis of COSY and HSQC spectra provided structural fragments (C-7′ to C-9′). The linkage of phenanthrene unit and the phenylpropane moiety through a dioxin bridge was also confirmed, showing similarities to compound 2.
The relative configuration of H-7′ and H-8′ was determined to be trans, based on the coupling constant (J = 8 Hz), and NOESY correlations between H-8′ and H-2′ indicated that H-8′ and the phenylpropane group lie in the same plane. The absolute configurations of the chiral centers were established by comparing experimental electronic circular dichroism (ECD) spectra with those of dendrocandin P1. Compound 4 exhibited a similar trend of a negative Cotton effect around 251 nm (Δε = −0.56), suggesting that the absolute configuration of this compound is 7′S, 8′S. Consequently, compound 4 was elucidated as a new phenanthrene derivative with the proposed structure and assigned a trivial name cymucronin D (Figure ).
4.

CD spectrum of compounds 2 and 4.
Cytotoxicity of Isolated Compounds on U-87 Glioblastoma Cell Line
This research evaluated isolated compounds (1–3, 5–9) for their cytotoxic activity against U-87 glioblastoma cell line using the CCK-8 assay. Compounds 4, 10, and 11 were not tested due to their limited quantity. To validate the experiments, doxorubicin (DOX), a chemotherapeutic agent, was selected as a positive control. Preliminary screening of the ethyl acetate extract from C. mucronatus showed significant cytotoxicity, resulting in a cell viability of 16.3% at a concentration of 50 μg/mL. The isolated compounds were screened for their dose-dependent cytotoxicity against U-87 MG glioma cells at 10 μM and 100 μM concentrations (Figure A). Among all tested compounds, compounds 3 and 9 were selected due to their remarkably low cell viability values of 8.38 ± 0.4 and 11.89 ± 0.6%, respectively, at 100 μM. These values are significantly lower than those of other compounds, which exhibited cell viability >30% at the same dose. This strong cytotoxic response demonstrated the superior potency of compounds 3 and 9 against U-87 MG glioma cells. The positive control, doxorubicin (DOX), at its IC50 dose of 0.3 μM, resulted in 49.6 ± 1.9% cell viability, confirming the reliability and accuracy of the cytotoxicity assay. Based on their promising initial results, compounds 3 and 9 were further evaluated to determine their IC50 values through dose-dependent cytotoxicity analysis across a 10–100 μM concentration range (Figure B). The analysis revealed IC50 values of 19.91 ± 4.28 μM for compound 3 and 17.07 ± 3.72 μM for compound 9, further validating their potential as anticancer agents (Figure E).
5.

Dose-dependent effects of isolated compounds on cell viability in U-87 MG Glioma Cells. (A) Cell viability (%) after treatment with isolated compounds (1–3, 5–9) at 10 μM and 100 μM concentrations. (B) Cell viability (%) following treatment with compound 3 and compound 9 at concentrations of 10, 20, 40, 60, 80, and 100 μM, and the control agent doxorubicin (DOX) at its IC50 dose of 0.3 μM. Data are shown as mean ± SD; statistical significance is indicated as $ p < 0.0001 comparing 10 and 100 μM doses and *p < 0.005, ** p < 0.0001 compared to media control.
6.

Comparative cytotoxicity analysis of compounds 3 and 9 on various cell lines. (A–D) Dose-dependent cell viability curves for U-87 MG (glioblastoma), HEK 293 (human embryonic kidney), BJ (human fibroblasts), and EA.hy926 (human endothelial cells) treated with compounds 3 and 9. Cell viability was assessed across a range of concentrations (0–100 μM). (E–H) Dose–response curves on a logarithmic scale, with the calculated IC50 values for compounds 3 and 9 indicated in each graph. (I–J) Fluorescence images of U-87 MG cells double-stained with Hoechst 33342 (blue) and PI (red) to simultaneously assess apoptosis and necrosis as mechanisms of cell death. White arrows indicate nuclear morphology and chromatin condensation typical of apoptotic cells (bright, condensed, fragmented nuclei).
The dose-dependent cytotoxicity (Figures A–D), IC50 values (Figures E–H), and selectivity indices (SI) of compounds 3 and 9 were also evaluated across three noncancerous cell lines: HEK 293 (human embryonic kidney cells), BJ (human fibroblasts), and EA.hy926 (human endothelial cells) (Table ). As a result, Compound 9 demonstrated better selectivity in HEK 293 cells (IC50 = 18.51 ± 4.77 μM, SI = 1.08), with an SI value slightly above 1, suggesting some preference for cancer cells over normal cells. However, it exhibited notable cytotoxicity against BJ fibroblasts (IC50 = 9.69 ± 5.59 μM, SI = 0.57) and EA.hy926 cells (IC50 = 11.35 ± 4.87 μM, SI = 0.66), with SI values below 1, indicating potential toxicity to these normal cell lines. This limited selectivity makes compound 9 less favorable for further development.
4. IC50 Values and Selectivity Index (SI) of Compounds 3 and 9 Across Cancer and Noncancerous Cell Lines .
| cell type | compound 3 IC50 μM (SI) | compound 9 IC50 μM (SI) |
|---|---|---|
| U-87 MG | 19.91 ± 4.28 | 17.08 ± 3.72 |
| HEK 293 | 8.14 ± 2.72 (0.41) | 18.51 ± 4.77 (1.08) |
| BJ | 35.01 ± 5.30 (1.76) | 9.69 ± 5.59 (0.57) |
| EA.hy926 | 21.83 ± 6.62 (1.10) | 11.35 ± 4.87 (0.66) |
Selectivity Index (SI) = IC50 (noncancerous cells)/IC50 (cancer cells).
In contrast, compound 3 exhibited high cytotoxicity in HEK 293 cells (IC50 = 8.14 ± 2.72 μM, SI = 0.41), indicating poor selectivity and potential toxicity toward this normal cell line. This SI value of less than 1 suggests that the compound may be toxic to both normal and cancer cells, raising concerns about its suitability for drug development. However, compound 3 demonstrated moderate selectivity in BJ fibroblasts (IC50 = 35.01 ± 5.30 μM, SI = 1.76) and EA.hy926 cells (IC50 = 21.83 ± 6.62 μM, SI = 1.10), with SI values greater than 1, indicating that it is more cytotoxic to cancer cells than to these normal cells. Due to its relatively safer profile in BJ fibroblasts and EA.hy926 cells, compound 3 was selected for further evaluation of its cell death mechanisms to better understand its therapeutic potential.
Fluorescence microscopy analysis was conducted to evaluate the mode of cell death induced by compounds 3 and 9 in U-87 MG glioblastoma cells. Cells were costained with Hoechst 33342 to assess nuclear morphology and PI to detect loss of membrane integrity, indicative of necrosis or late apoptosis. In untreated control samples, nuclei appeared uniformly stained and round, consistent with healthy, viable cells. Treatment with both compounds at concentrations of 10 μM and 20 μM resulted in a marked increase in cells displaying bright, condensed, and fragmented nuclei, as indicated by white arrows, which are characteristic of apoptotic cell death. This effect was more pronounced at the higher concentration (20 μM), suggesting a dose-dependent induction of apoptosis. In contrast, PI staining was minimal across all treatment groups, indicating that necrosis was not a predominant mechanism of cell death under these conditions. These results demonstrate that both compounds 3 and 9 primarily induce apoptosis in U-87 MG cells without significant necrotic activity.
Structural analysis revealed that compound 3 is a hybrid of nudol and erianthridin, both of which were identified as major constituents of C. mucronatus. Interestingly, despite nudol (6) and erianthridin (7) individually exhibiting no cytotoxic activity, their combined structure in compound 3 resulted in a significant cytotoxic effect. This suggests that the fusion of these molecular frameworks may introduce new functional interactions that enhance their bioactivity.
(A–D) Dose-dependent cell viability curves for U-87 MG (glioblastoma), HEK 293 (human embryonic kidney), BJ (human fibroblasts), and EA.hy926 (human endothelial cells) treated with compounds 3 and 9. Cell viability was assessed across a range of concentrations (0–100 μM). (E–H) Dose–response curves on a logarithmic scale, with the calculated IC50 values for compounds 3 and 9 indicated in each graph. (I–J) Fluorescence images of U-87 MG cells double-stained with Hoechst 33342 (blue) and PI (red) to simultaneously assess apoptosis and necrosis as mechanisms of cell death. White arrows indicate nuclear morphology and chromatin condensation typical of apoptotic cells (bright, condensed, fragmented nuclei).
Phenotypic Analysis of Apoptosis and Necrosis via Flow Cytometry
The Annexin V-FITC/PI assay was used to determine the proportion of cells undergoing apoptosis and necrosis by detecting changes in membrane phospholipid distribution and integrity. This test provides a phenotypic profile of cell death stages to evaluate the cytotoxic effects of the treatment. The staining results clearly demonstrate that both compound 3 and Dox induce apoptosis in cancer cells when administered at their IC50 concentrations (Figure ). Compared to the untreated control, which exhibited predominantly viable cells, treatment with compound 3 led to a marked increase in both early and late apoptotic populations. This suggests that compound 3 effectively initiates and progresses apoptotic signaling pathways, resulting in programmed cell death.
7.

Induction of apoptosis by compound 3 and Dox at IC50 concentrations analyzed by Annexin V-FITC/PI staining. Representative dot plots showing (A) the untreated control group, (B) cells treated with compound 3, and (C) the Dox-treated group (positive control). In the Annexin V-FITC/PI dot plots, live cells are located in the lower left quadrant (Annexin V–/PI−), early apoptotic cells in the lower right (Annexin V+/PI−), late apoptotic cells in the upper right (Annexin V+/PI+), and necrotic or dead cells in the upper left quadrant (Annexin V–/PI+). The color scale indicates event density: blue represents low cell density (fewer events), while red represents high density (more events). Panel (D) presents the quantitative analysis of cell populations, showing that both compound 3 and Dox significantly increased apoptotic cells compared to the untreated control. Data are shown as mean ± SD; statistical significance is indicated as *p < 0.05 compared to Dox.
Dox, used as a positive control, produced a robust apoptotic response, as expected for a clinically established chemotherapeutic agent. Interestingly, while the overall apoptotic profile induced by compound 3 was comparable to Dox, subtle differences in the distribution between early and late apoptosis may reflect distinct mechanisms of action or differences in the timing of apoptotic progression. The color density in the dot plots reinforces these findings, with higher cellular events (red zones) concentrated in the apoptotic quadrants for both compound 3 and Dox, confirming that apoptosis is the dominant mode of cell death under these treatment conditions. These results suggest that compound 3 has strong pro-apoptotic potential and may serve as a promising anticancer candidate, either alone or in combination with existing therapies like Dox.
Conclusions
This study reports the isolation of four new compounds, cymucronins A-D (1-4) and seven known compounds (5-11) from the whole plant of Cylindrolobus mucronatus. The structures of the newly identified compounds were determined through detailed spectroscopic analysis. Cytotoxic evaluation against U-87 MG glioblastoma cells revealed that compounds 3 and 9 exerted marked anticancer activity, primarily through the induction of apoptosis, as confirmed by fluorescence microscopy and flow cytometry. Among them, compound 3 demonstrated favorable selectivity toward cancer cells over certain normal cell lines and showed an apoptotic profile comparable to Dox. This work constitutes the first report on the chemical composition and biological activity of C. mucronatus, highlighting its potential as a promising source of bioactive natural products.
Experimental Section
General Experimental Procedures
Optical rotation was measured using a Jasco P-2000 digital polarimeter (Easton, MD). UV spectra were recorded with a Milton Roy Spectronic 3000 Array spectrophotometer (Rochester, NY). Circular dichroism (CD) spectra were obtained using a Jasco J-815 CD spectrophotometer (Hachioji, Tokyo, Japan). Fourier-transform infrared (FT-IR) spectra were collected using a PerkinElmer FT-IR 1760X spectrophotometer (Boston, MA). Mass spectra were analyzed with a Bruker MicroTOF mass spectrometer (ESI-MS) (Billerica, MA). NMR spectra were recorded on a Bruker Avance Neo 600 and 400 MHz NMR spectrometer (Billerica, MA). Vacuum-liquid chromatography (VLC) and column chromatography (CC) were performed using silica gel 60 (Merck No. 1.07734.2500, particle size 0.063–0.200 mm) and silica gel 60 (Merck No. 1.09385.2500, particle size 0.040–0.063 mm) (Merck, NJ). Gel filtration chromatography was conducted with Sephadex LH-20 (Merck, NJ). Preparative thin-layer chromatography was carried out on Silica gel 60 F254 precoated plates (E. Merck), measuring 20 × 20 cm. The purity of isolated compounds was initially assessed by thin-layer chromatography (TLC) using silica gel 60 F254 plates (Merck, NJ) under UV light. The U87-MG human glioblastoma cell line (ATCC HTB-14), HEK 293 human embryonic kidney cell line (ATCC CRL-1573), EA.hy926 endothelial cell line (ATCC CRL-2922), and BJ human fibroblast (ATCC CRL-2522) cell lines were purchased from the American Type Culture Collection (ATCC, Manassas, VA). All cells were cultured in Dulbecco’s Modified Eagle Medium (DMEM; Gibco, Thermo Fisher Scientific, NY) supplemented with 10% fetal bovine serum (FBS; Gibco, Thermo Fisher Scientific, NY) and 1% penicillin-streptomycin (Gibco, Thermo Fisher Scientific, NY), unless otherwise stated. Cultures were maintained in a humidified incubator at 37 °C with 5% CO2. Cell Counting Kit-8 (ab228554) was purchased from Abcam, Cambridge, UK.
Plant Material
The whole plant specimens of Cylindrolobus mucronatus were obtained from Chatuchak Market (Bangkok, Thailand) in May 2023. The species was authenticated by Mr. Yanyong Punpreuk, Department of Agriculture, Ministry of Agriculture and Cooperatives, Bangkok, Thailand. A voucher specimen (BS-CM-052566) has been deposited in the Department of Pharmacognosy and Pharmaceutical Botany, Faculty of Pharmaceutical Sciences, Chulalongkorn University.
Extraction and Isolation
Air-dried plant material (2 kg) was subjected to maceration with methanol, yielding a methanol extract (109.36 g) after solvent removal. Solvent partitioning of the methanol extract resulted in an ethyl acetate fraction (62.41 g) and an aqueous fraction (30.25 g). Preliminary studies demonstrated that the ethyl acetate extract exhibited significant inhibitory activity against glioblastoma cells, whereas the other fractions showed no activity. Consequently, the ethyl acetate extract was selected for further phytochemical investigation. The ethyl acetate extract was fractionated by vacuum liquid chromatography on silica gel using a dichloromethane-ethyl acetate gradient, producing five fractions (A–E). Fraction B (17.92 g) was further separated by silica gel column chromatography (hexane-acetone gradient), yielding five fractions (B1–B5). Fraction B3 (2.53 g) was subjected to Sephadex LH-20 column chromatography (acetone), resulting in four fractions (B3A–B3D). Fraction B3C (683.9 mg) was further separated using silica gel column chromatography (dichloromethane-hexane gradient) to produce six fractions (B3C1–B3C6). From these, compound 5 (9.3 mg) was isolated from fraction B3C2 by silica gel column chromatography (dichloromethane-hexane gradient).
Fraction B3C3 was further purified via silica gel column chromatography (hexane-ethyl acetate, 85:15 to 60:40), yielding compound 1 (4.5 mg). Fraction B3C4 (118.4 mg) was subjected to silica gel column chromatography (dichloromethane-hexane gradient 70:30 to 100:0) to produce compounds 5 (64.3 mg) and 6 (2.4 mg). Fraction B3C5 (755.2 mg) was processed using a Sephadex LH-20 column (methanol), affording compounds 6 (215.0 mg) and 7 (128.3 mg). Fraction B3D was purified using silica gel column chromatography (dichloromethane), yielding compound 8 (8.7 mg). Fraction C (5.78 g) underwent silica gel column chromatography (dichloromethane-acetone gradient), resulting in five fractions (C1–C5). Fraction C3 (916.6 mg) was separated by column chromatography (hexane-acetone, 100:0 to 75:25), producing four fractions (C3A–C3D). Fraction C3B was purified via silica gel column chromatography (dichloromethane-ethyl acetate, 100:0 to 75:25), yielding compound 2 (3.1 mg). Fraction C3D underwent Sephadex LH-20 column chromatography (methanol) followed by preparative thin-layer chromatography (dichloromethane-methanol, 98:2), resulting in compound 3 (4.3 mg).
Fraction C4 (1.94 g) was further fractionated using a Sephadex LH-20 column (methanol), producing five fractions (C4A–C4E). Fraction C4B (86.0 mg) was subjected to silica gel column chromatography (dichloromethane-methanol, 98:2), yielding five fractions (C4B1–C4B5). Fraction C4B2 was purified by preparative thin-layer chromatography (dichloromethane-methanol, 98:2), affording compound 4 (2.7 mg). Fraction C4B5 was also separated using preparative thin-layer chromatography (hexane-ethyl acetate, 50:50), yielding compounds 9 (3.4 mg) and 10 (1.4 mg). Additionally, compound 11 (1.1 mg) was isolated from fraction C4E via silica gel column chromatography (hexane-ethyl acetate, 60:40).
Cymucronin A (1)
Brown amorphous solid; UV(MeOH) λmax (log ε): 215 (4.23), 270 (4.55), 315 (3.85) nm; IR νmax: 3391, 2922, 2852, 1724, 1610, 1467, 1394, 1259 cm–1; HR-ESI-MS: [M-H] – at m/z 329.1036 (calcd. for 329.1025, C18H17O6 –).
Cymucronin B (2)
Brown amorphous solid; [α]D 25 +14 (c 0.0005, MeOH), UV (MeOH) λmax (log ε): 205 (4.63), 265 (4.37), 493 (3.89) nm; IR νmax: 3393, 2918, 2850, 1729, 1613, 1516, 1463, 1262 cm–1; HR-ESI-MS: [M-H] – at m/z 537.1753 (calcd. for 537.1760, C29H29O10 –).
Cymucronin C (3)
Brown amorphous solid; UV (MeOH) λmax (log ε): 215 (5.00), 265 (4.98) nm; IR νmax: 3372, 2926, 2853, 1704, 1611, 1500, 1467, 1291 cm–1; HR-ESI-MS: [M + H] + at m/z 541.1857 (calcd. for 541.1862, C32H29O8 +).
Cymucronin D (4)
Brown amorphous solid; [α]D 25 +10 (c 0.0005, MeOH), UV (MeOH) λmax (log ε): 205 (3.74), 270 (2.48), 315 (3.54), 350 (3.01), 370 (3.00) nm; IR νmax: 3357, 2920, 2850, 1611, 1521, 1466, 1339, 1260 cm–1; HR-ESI-MS: [M + H] + at m/z 495.1667 (calcd. for 495.1655, C27H27O9 +).
Cell Viability Assay via CCK-8
Cell viability was assessed using the Cell Counting Kit-8 (CCK-8; Abcam, Cambridge, UK) according to the manufacturer’s protocol. U-87 MG, HEK 293, BJ, and EA.hy926 cells were seeded into 96-well plates at a density of 1 × 10⁴ cells per well and incubated for 24 h. After incubation, the cells were treated with test compounds (1-3, 5-9) at various concentrations (10 and 100 μM) in DMSO for 24 h. The final concentration of DMSO in each well was maintained at 0.5%, a noncytotoxic concentration. Compounds 4, 10, and 11 were excluded due to insufficient quantity. Doxorubicin (Dox) was used as a positive control. Following treatment, 10 μL of CCK-8 solution was added to each well and incubated for an additional 1 h at 37 °C in the dark. Absorbance was measured at 450 nm using a microplate reader (CLARIOstar, BMG Labtech, Ortenberg, Germany). Cell viability was calculated as a percentage relative to untreated controls. The absorbance ratio of treated cells to control cells, which were incubated with 0.5% DMSO as a solvent vehicle, was used to determine viability.
Furthermore, the half-maximal inhibitory concentration (IC50) was determined for compounds 3 and 9 to assess effectiveness. The selectivity index (SI) was determined as the ratio of the IC50 value in HEK 293, BJ, and EA. hy926 cells to the IC50 in U-87 MG cancer cells, providing insight into the relative toxicity toward cancer vs normal cells. All experiments were conducted in quadruplicate, and data were reported as mean ± SD.
Apoptotic Nuclear Morphology Analysis (Hoechst 33342 and PI Staining)
Hoechst 33342 and PI costaining was performed to determine the mode of cell death following treatment with the test compounds. Briefly, U-87 MG cells were seeded in a black 96-well plate and allowed to adhere overnight. The cells were then treated with compounds 3 and 9 at concentrations of 20 μM and 10 μM, respectively, for 24 h. After treatment, the cells were washed twice with phosphate-buffered saline (PBS), followed by staining with Hoechst 33342 (10 μg/mL) and PI (15 μg/mL) for 30 min at 37 °C in the dark. Subsequently, the cells were washed twice with PBS, and nuclear morphology was visualized using a fluorescence microscope (Olympus IX51, Tokyo, Japan). Representative images were captured and analyzed to evaluate apoptotic morphology and to confirm the dominant mode of cell death. Cells exhibiting chromatin condensation or fragmentation were considered apoptotic, while those positive for both Hoechst and PI were considered late apoptotic or necrotic. The results were postprocessed using ImageJ software.
Flow Cytometry Analysis (Annexin V-FITC/PI Double Staining)
Annexin V-FITC/PI double staining was performed to determine the population of apoptotic and necrotic cells using the FITC Annexin V Apoptosis Detection Kit with PI (Biolegend, San Diego, CA), following the manufacturer’s instructions. U-87 MG cells were seeded in a 24-well plate at a density of 1 × 10⁵ cells/well and incubated overnight. The cells were then treated with compound 3 at its IC50 concentration (20 μM) for 24 h. Dox (0.3 μM) was used as the positive control, and untreated cells served as the negative control. After incubation, the cells were washed with cold PBS, trypsinized, and harvested by centrifugation at 1000 × g for 5 min. The cell pellet was resuspended in 100 μL of 1× binding buffer and stained with 5 μL of Annexin V-FITC and 5 μL of PI for 15 min at room temperature in the dark. Then, 100 μL of each stained sample was transferred to a FACS-compatible plate and acquired using a BD Accuri C6 Plus flow cytometer (BD Biosciences, CA). At least 10,000 events per sample were collected. The results were analyzed using FlowJo software (version 10, FlowJo LLC, CA). Cell populations were classified as viable, early apoptotic, late apoptotic, or necrotic.
Statistical Analysis
Data were expressed as mean ± standard deviation (SD) from three independent experiments. GraphPad Prism (version 9.5.1, GraphPad Software, San Diego, CA) was used for statistical analysis and data visualization. IC50 values were calculated by fitting dose–response curves to a four-parameter logistic (4PL) model. One-way analysis of variance (ANOVA), followed by posthoc testing, was used to evaluate differences between groups, with p < 0.05 considered statistically significant.
Supplementary Material
Acknowledgments
The authors would like to thank the Faculty of Pharmaceutical Sciences at Chulalongkorn University for providing the research facilities essential to the completion of this work. The photograph of the plant used in this study was provided by Mr. Apichat Wikhamchai and is used here with his permission. Additionally, S.L.Y.S. gratefully acknowledges Chulalongkorn University’s Graduate Scholarship Program for ASEAN or Non-ASEAN Countries. K.P.A. would also like to acknowledge the Chulalongkorn University, the Second Century Fund (C2F).
The Supporting Information is available free of charge at https://pubs.acs.org/doi/10.1021/acsomega.5c04743.
HR-ESI-MS spectra; UV spectra; FT-IR spectra; 1D and 2D NMR of compounds 1–4 (PDF)
S.L.Y.S.: methodology, data curation, formal analysis, investigation, validation, visualization, writingoriginal draft. K.P.A.: methodology, data curation, formal analysis, investigation, validation, visualization, writingoriginal draft, writingreview and editing. M.T.T.: validation, writingreview and editing. Y.P: data curation, investigation. W.M.: data curation, investigation. V.K.: validation, writingreview and editing. P.R.: conceptualization, supervision, methodology, resources, formal analysis, writingreview and editing. B.S.: conceptualization, methodology, investigation, formal analysis, supervision, resources, project, writingreview and editing.
This research was supported by Thailand Science Research and Innovation Fund, Chulalongkorn University (HEA-FF-68-006-3300-002) (B.S.), and the Ratchadaphisek Somphot Endowment Fund, for the Center of Excellence in Natural Products for Aging and Chronic Diseases (CE68-011-3300-006) (P.R.).
The authors declare no competing financial interest.
References
- Sung H., Ferlay J., Siegel R. L., Laversanne M., Soerjomataram I., Jemal A., Bray F.. Global cancer statistics 2020: GLOBOCAN estimates of incidence and mortality worldwide for 36 cancers in 185 countries. CA Cancer J. Clin. 2021;71:209–249. doi: 10.3322/caac.21660. [DOI] [PubMed] [Google Scholar]
- Stanaway J. D., Afshin A., Gakidou E., Lim S. S., Abate D., Abate K. H., Abbafati C., Abbasi N., Abbastabar H., Abd-Allah F.. Global, regional, and national comparative risk assessment of 84 behavioural, environmental and occupational, and metabolic risks or clusters of risks for 195 countries and territories, 1990–2017: a systematic analysis for the Global Burden of Disease Study 2017. Lancet. 2018;392:1923–1994. doi: 10.1016/S0140-6736(18)32225-6. [DOI] [PMC free article] [PubMed] [Google Scholar]
- Guilbaud N., Kraus-Berthier L., Meyer-Losic F., Malivet V., Chacun C., Jan M., Tillequin Fo., Michel S., Koch M., Pfeiffer B.. Marked antitumor activity of a new potent acronycine derivative in orthotopic models of human solid tumors. Clin. Cancer Res. 2001;7:2573–2580. [PubMed] [Google Scholar]
- Moraes, D. F. C. ; de Mesquita, L. S. S. ; do Amaral, F. M. M. ; de Sousa Ribeiro, M. N. ; Malik, S. . Anticancer Drugs from Plants: Biotechnology and Production of Anti-cancer Compounds.; Springer; 2017, 121–142. [Google Scholar]
- Greenwell M., Rahman P.. Medicinal plants: their use in anticancer treatment. Int. J. Pharm. Sci. Res. 2015;6:4103. doi: 10.13040/IJPSR.0975-8232.6(10).4103-12. [DOI] [PMC free article] [PubMed] [Google Scholar]
- Singh S., Singh A. K., Kumar S., Kumar M., Pandey P. K., Singh M. C. K.. Medicinal properties and uses of orchids: a concise review. Elixir. Appl. Botany. 2012;52:11627–11634. [Google Scholar]
- Gutiérrez R. M. P.. Orchids: A review of uses in traditional medicine, its phytochemistry and pharmacology. J. Med. Plants Res. 2010;4:592–638. [Google Scholar]
- Pant, B. ; Raskoti, B. B. . Medicinal Orchids of Nepal; Himalayan Map House, 2013. [Google Scholar]
- Newman D. J.. Natural products as leads to potential drugs: an old process or the new hope for drug discovery? J. Med. Chem. 2008;51:2589–2599. doi: 10.1021/jm0704090. [DOI] [PubMed] [Google Scholar]
- Attri L.. Therapeutic potential of orchids. WJPPS. 2016;5:438–446. [Google Scholar]
- Boonjing S., Pothongsrisit S., Wattanathamsan O., Sritularak B., Pongrakhananon V.. Erianthridin induces non-small cell lung cancer cell apoptosis through the suppression of extracellular signal-regulated kinase activity. Planta Med. 2021;87:283–293. doi: 10.1055/a-1295-8606. [DOI] [PubMed] [Google Scholar]
- Sanookpan K., Nonpanya N., Sritularak B., Chanvorachote P.. Ovalitenone inhibits the migration of lung cancer cells via the suppression of AKT/mTOR and epithelial-to-mesenchymal transition. Molecules. 2021;26:638. doi: 10.3390/molecules26030638. [DOI] [PMC free article] [PubMed] [Google Scholar]
- Bhummaphan N., Petpiroon N., Prakhongcheep O., Sritularak B., Chanvorachote P.. Lusianthridin targeting of lung cancer stem cells via Src-STAT3 suppression. Phytomedicine. 2019;62:152932. doi: 10.1016/j.phymed.2019.152932. [DOI] [PubMed] [Google Scholar]
- Mittraphab A., Muangnoi C., Likhitwitayawuid K., Rojsitthisak P., Sritularak B.. A new bibenzyl-phenanthrene derivative from Dendrobium signatum and its cytotoxic activity. Nat. Prod. Commun. 2016;11:657–659. doi: 10.1177/1934578X1601100526. [DOI] [PubMed] [Google Scholar]
- Charoenrungruang S., Chanvorachote P., Sritularak B., Pongrakhananon V.. Gigantol, a bibenzyl from Dendrobium draconis, inhibits the migratory behavior of non-small cell lung cancer cells. J. Nat. Prod. 2014;77:1359–1366. doi: 10.1021/np500015v. [DOI] [PubMed] [Google Scholar]
- Albericio F.. The pharmaceutical industry in 2018. An analysis of FDA drug approvals from the perspective of molecules. Molecules. 2019;24:809. doi: 10.3390/molecules24040809. [DOI] [PMC free article] [PubMed] [Google Scholar]
- Thant M. T., Sritularak B., Chatsumpun N., Mekboonsonglarp W., Punpreuk Y., Likhitwitayawuid K.. Three novel biphenanthrene derivatives and a new phenylpropanoid ester from Aerides multiflora and their α-glucosidase inhibitory activity. Plants. 2021;10:385. doi: 10.3390/plants10020385. [DOI] [PMC free article] [PubMed] [Google Scholar]
- Kongkatitham V., Dehlinger A., Wang M., Poldorn P., Weidinger C., Letizia M., Chaotham C., Otto C., Ruprecht K., Paul F.. et al. Immunomodulatory effects of new phenanthrene derivatives from Dendrobium crumenatum . J. Nat. Prod. 2023;86:1294–1306. doi: 10.1021/acs.jnatprod.3c00107. [DOI] [PubMed] [Google Scholar]
- Teoh, E.-S. Orchid Species from Himalaya and Southeast Asia. Vol. 1,(A-E) Eng. Soon Teoh; Springer, 2021. [Google Scholar]
- Wu Y.-P., Liu W.-J., Zhong W.-J., Chen Y.-J., Chen D.-N., He F., Jiang L.. Phenolic compounds from the stems of Flickingeria fimbriata . Nat. Prod. Res. 2017;31:1518–1522. doi: 10.1080/14786419.2017.1278599. [DOI] [PubMed] [Google Scholar]
- Aminah N. S., Hidayah R., Tanjung M.. Confusarin and nudol, two phenathrene group compounds, from Dioscorea esculenta L. and their antioxidant acitivities. J. Chem. Technol. Metall. 2017;52:1135–1139. [Google Scholar]
- Yuan-Wah L., Chiang-Cheong K., Harrison L. J., Powell A. D.. Phenanthrenes, dihydrophenanthrenes and bibenzyls from the orchid Bulbophyllum vaginatum . Phytochemistry. 1997;44:157–165. doi: 10.1016/S0031-9422(96)00387-1. [DOI] [Google Scholar]
- Lin C.-W., Hwang T.-L., Chen F.-A., Huang C.-H., Hung H.-Y., Wu T.-S.. Chemical constituents of the rhizomes of Bletilla formosana and their potential anti-inflammatory Activity. J. Nat. Prod. 2016;79:1911–1921. doi: 10.1021/acs.jnatprod.6b00118. [DOI] [PubMed] [Google Scholar]
- Wang Y., Guan S.-H., Meng Y.-H., Zhang Y.-B., Cheng C.-R., Shi Y.-Y., Feng R.-H., Zeng F., Wu Z.-Y., Zhang J.-X.. et al. Phenanthrenes, 9, 10-dihydrophenanthrenes, bibenzyls with their derivatives, and malate or tartrate benzyl ester glucosides from tubers of Cremastra appendiculata . Phytochemistry. 2013;94:268–276. doi: 10.1016/j.phytochem.2013.06.001. [DOI] [PubMed] [Google Scholar]
- Yamaki M., Bai L., Inoue K., Takagi S.. Biphenanthrenes from Bletilla striata . Phytochemistry. 1989;28:3503–3505. doi: 10.1016/0031-9422(89)80373-5. [DOI] [Google Scholar]
- Uddin G., Latif A., Arfan M., Ali M., Hussain S. H., Simpson T. J., Cox R. J., Choudhary M. I.. Phytochemicals from the stem wood of Sorbus lanata (D. Don.) Schauer. Phytochem. Lett. 2013;6:84–89. doi: 10.1016/j.phytol.2012.10.002. [DOI] [Google Scholar]
- Zhao G.-Y., Deng B.-W., Zhang C.-Y., Cui Y.-D., Bi J.-Y., Zhang G.-G.. New phenanthrene and 9, 10-dihydrophenanthrene derivatives from the stems of Dendrobium officinale with their cytotoxic activities. J. Nat. Med. 2018;72:246–251. doi: 10.1007/s11418-017-1141-2. [DOI] [PubMed] [Google Scholar]
- Zhan R., Wang Z.-C., Yin B.-L., Liu Y., Chen Y.-G.. Novel 9, 10-dihydrophenanthrene derivatives from Eria bambusifolia with cytotoxicity aganist human cancer cells in vitro. Chin. J. Nat. Med. 2016;14:621–625. doi: 10.1016/S1875-5364(16)30073-5. [DOI] [PubMed] [Google Scholar]
- Yang W., Soares J., Greninger P., Edelman E. J., Lightfoot H., Forbes S., Bindal N., Beare D., Smith J. A., Thompson I. R.. et al. Genomics of drug sensitivity in cancer (GDSC): a resource for therapeutic biomarker discovery in cancer cells. Nucleic Acids Res. 2012;41:955–961. doi: 10.1093/nar/gks1111. [DOI] [PMC free article] [PubMed] [Google Scholar]
- Auberon F., Olatunji O. J., Raminoson D., Muller C. D., Soengas B., Bonté F., Lobstein A.. Isolation of novel stilbenoids from the roots of Cyrtopodium paniculatum (Orchidaceae) Fitoterapia. 2017;116:99–105. doi: 10.1016/j.fitote.2016.11.015. [DOI] [PubMed] [Google Scholar]
- Schneider C. A., Rasband W. S., Eliceiri K. W.. NIH Image to ImageJ: 25 years of image analysis. Nat. Methods. 2012;9:671–675. doi: 10.1038/nmeth.2089. [DOI] [PMC free article] [PubMed] [Google Scholar]
Associated Data
This section collects any data citations, data availability statements, or supplementary materials included in this article.