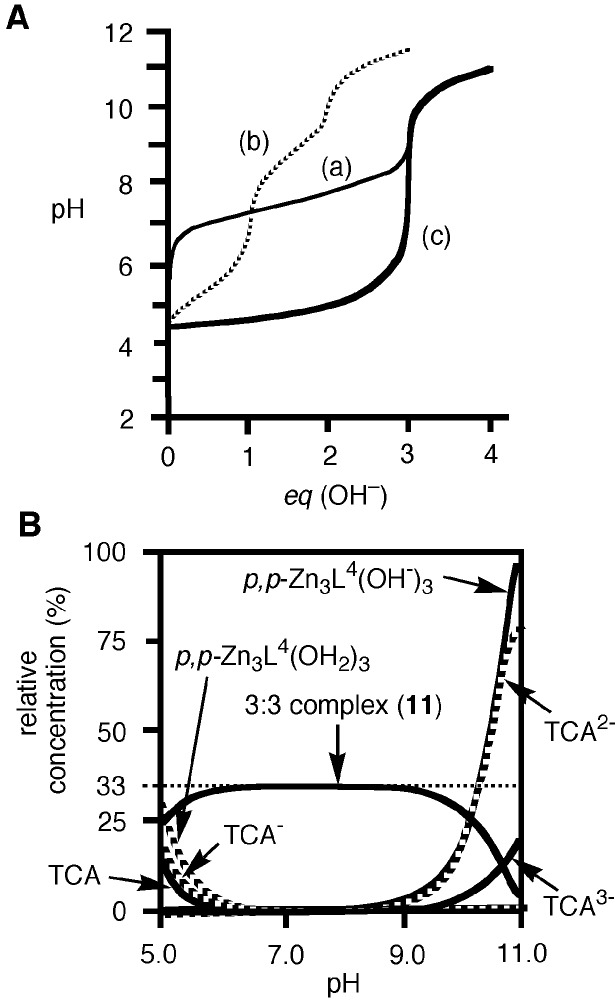
Figure 6.
(A) Typical pH titration curves of 0.5 mM 8 (a), 0.5 mM TCA (b), and 0.5 mM 8 + 0.5 mM TCA (c) in aqueous solution with I = 0.1 (NaNO3) at 25°C, where eq(OH−) is the number of equivalents of base (NaOH) added. (B) Speciation diagram for the 8 and TCA species in a 0.5 mM 8/0.5 mM TCA mixture as a function of pH at 25°C with I = 0.10 (NaNO3). For clarity, the species less than 5% are omitted.

